## Process Diagram: Reward Model Training Pipeline
### Overview
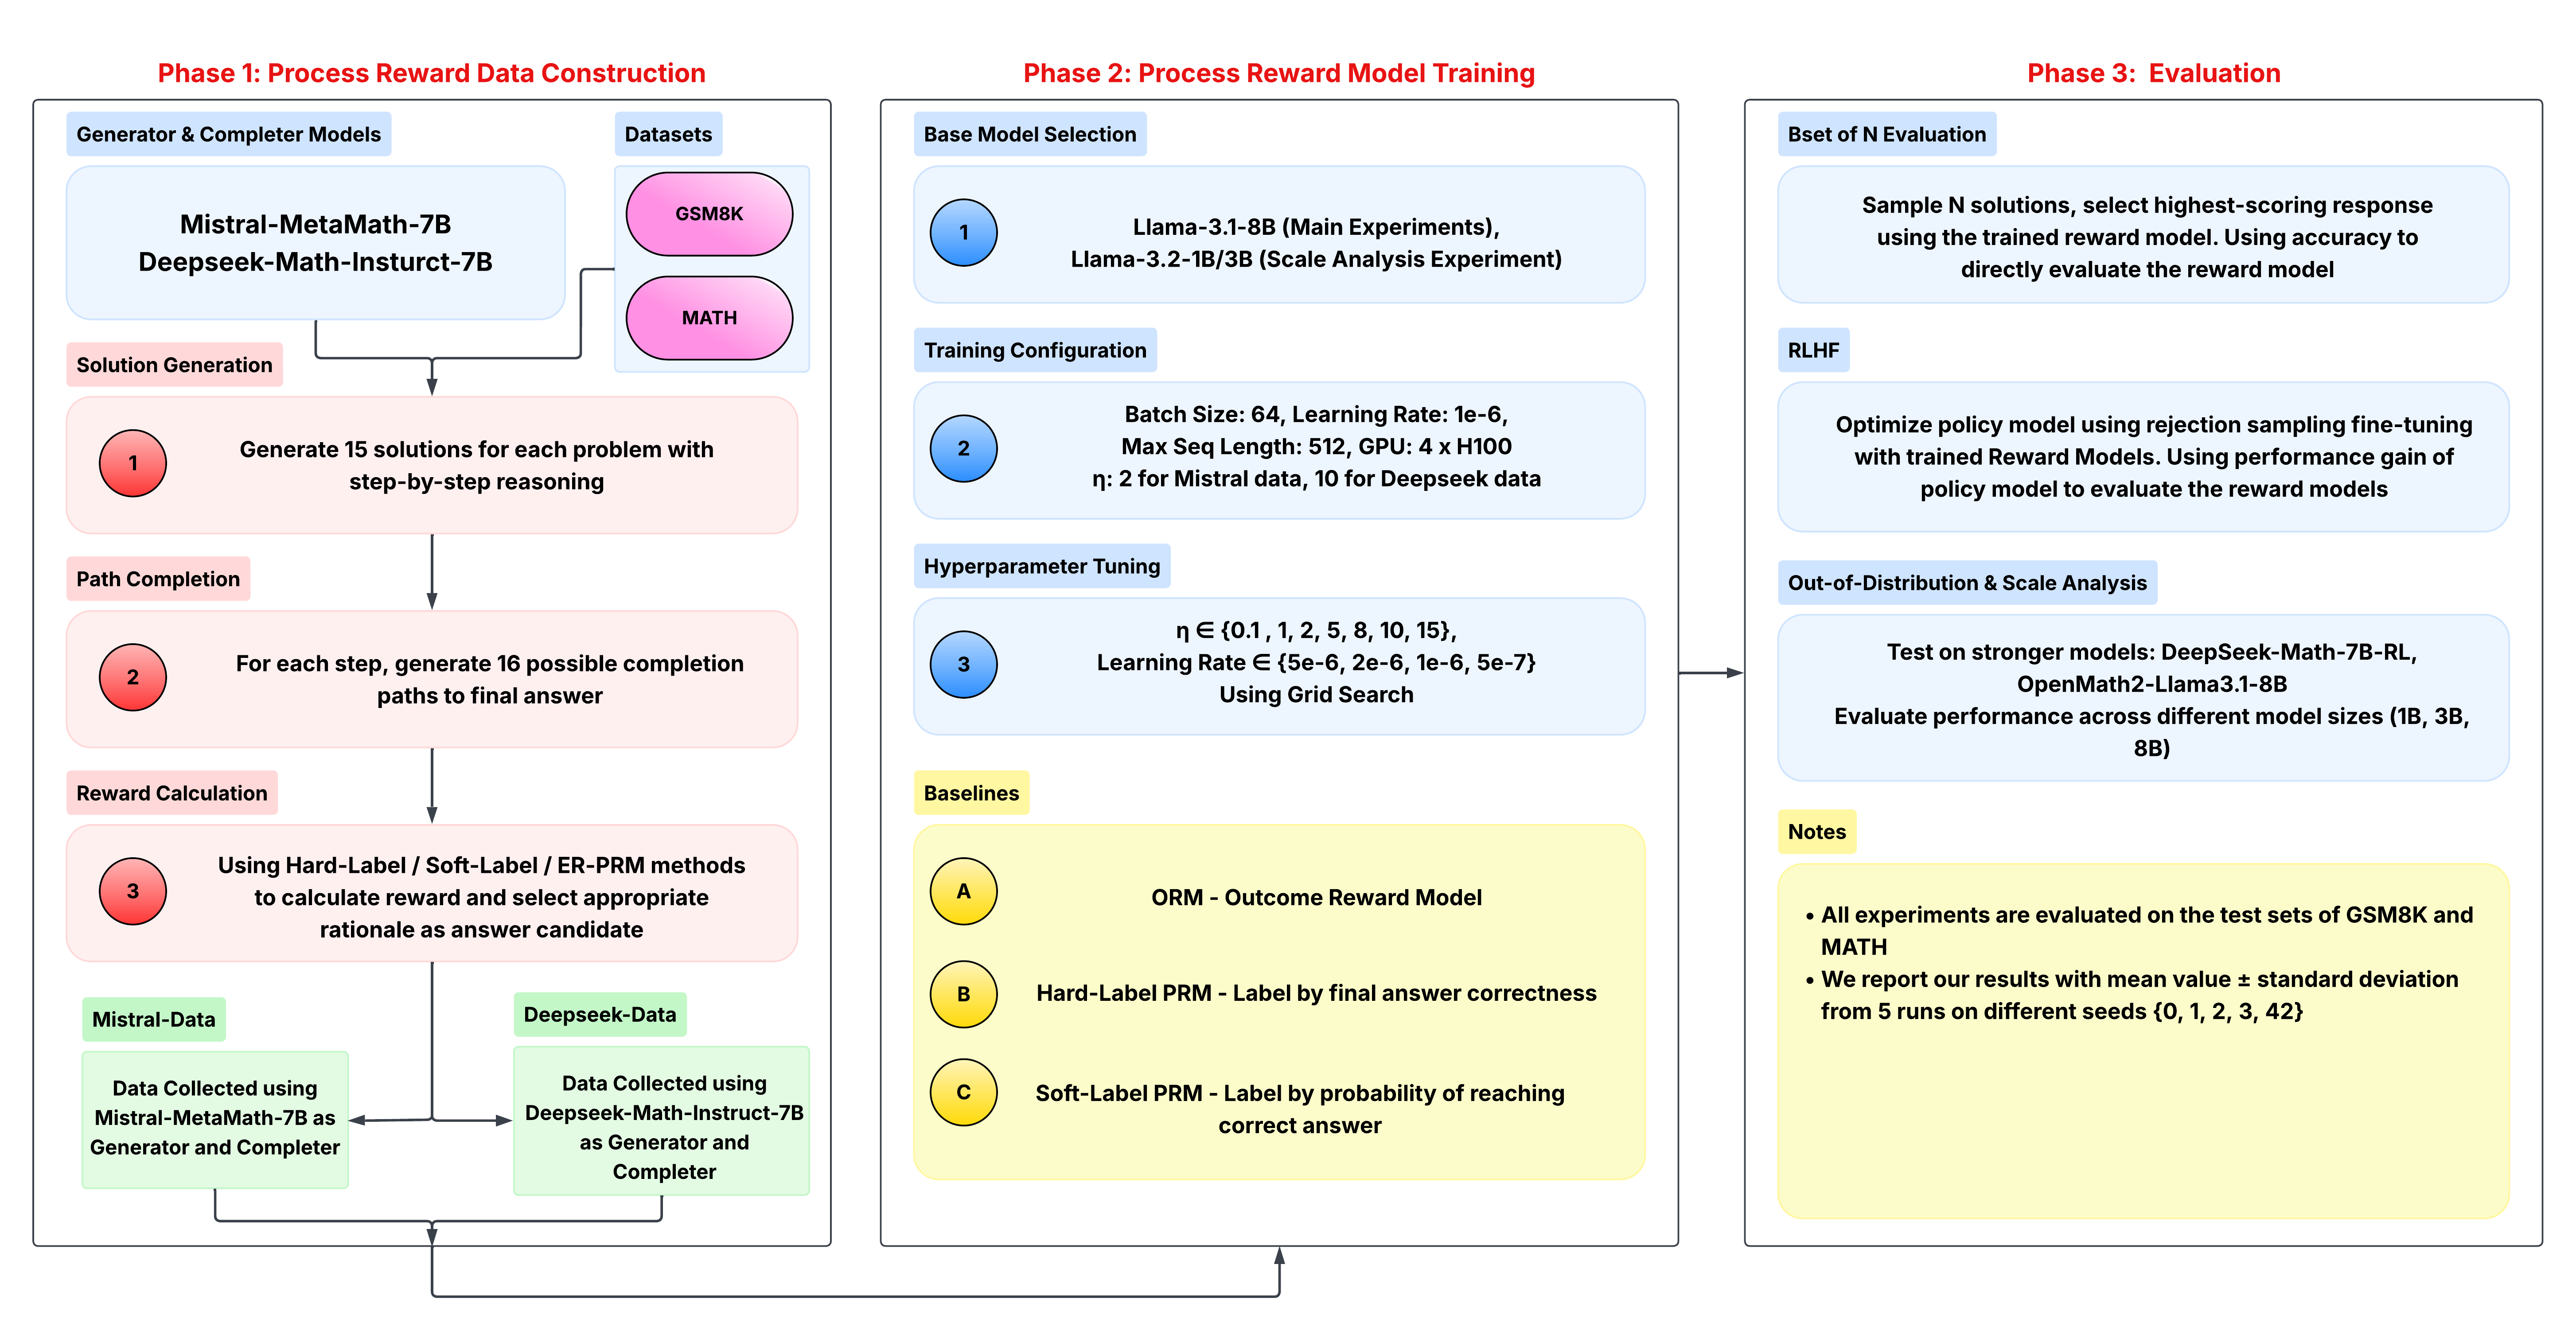
The image presents a process diagram outlining the pipeline for reward model training. It is divided into three phases: Process Reward Data Construction, Process Reward Model Training, and Evaluation. Each phase consists of several steps, detailing the data generation, model training, and evaluation processes.
### Components/Axes
**Phase 1: Process Reward Data Construction**
* **Generator & Completer Models:** Contains "Mistral-MetaMath-7B" and "Deepseek-Math-Instruct-7B".
* **Datasets:** Contains "GSM8K" and "MATH".
* **Solution Generation (Step 1):** Generate 15 solutions for each problem with step-by-step reasoning.
* **Path Completion (Step 2):** For each step, generate 16 possible completion paths to the final answer.
* **Reward Calculation (Step 3):** Using Hard-Label / Soft-Label / ER-PRM methods to calculate reward and select appropriate rationale as answer candidate.
* **Data Flow:** Mistral-Data (Data Collected using Mistral-MetaMath-7B as Generator and Completer) and Deepseek-Data (Data Collected using Deepseek-Math-Instruct-7B as Generator and Completer) feed into the Reward Calculation step.
**Phase 2: Process Reward Model Training**
* **Base Model Selection (Step 1):** Llama-3.1-8B (Main Experiments), Llama-3.2-1B/3B (Scale Analysis Experiment).
* **Training Configuration (Step 2):** Batch Size: 64, Learning Rate: 1e-6, Max Seq Length: 512, GPU: 4 x H100, η: 2 for Mistral data, 10 for Deepseek data.
* **Hyperparameter Tuning (Step 3):** η ∈ {0.1, 1, 2, 5, 8, 10, 15}, Learning Rate ∈ {5e-6, 2e-6, 1e-6, 5e-7} Using Grid Search.
* **Baselines:**
* A: ORM - Outcome Reward Model
* B: Hard-Label PRM - Label by final answer correctness
* C: Soft-Label PRM - Label by probability of reaching correct answer
**Phase 3: Evaluation**
* **Bset of N Evaluation:** Sample N solutions, select highest-scoring response using the trained reward model. Using accuracy to directly evaluate the reward model.
* **RLHF:** Optimize policy model using rejection sampling fine-tuning with trained Reward Models. Using performance gain of policy model to evaluate the reward models.
* **Out-of-Distribution & Scale Analysis:** Test on stronger models: DeepSeek-Math-7B-RL, OpenMath2-Llama3.1-8B. Evaluate performance across different model sizes (1B, 3B, 8B).
* **Notes:**
* All experiments are evaluated on the test sets of GSM8K and MATH.
* We report our results with mean value ± standard deviation from 5 runs on different seeds {0, 1, 2, 3, 42}.
### Detailed Analysis or ### Content Details
**Phase 1:**
* Two models, Mistral-MetaMath-7B and Deepseek-Math-Instruct-7B, are used to generate and complete solutions.
* The datasets used are GSM8K and MATH.
* The process involves generating 15 solutions per problem, then generating 16 possible completion paths for each step.
* Reward is calculated using Hard-Label, Soft-Label, or ER-PRM methods.
**Phase 2:**
* Base models used are Llama-3.1-8B and Llama-3.2-1B/3B.
* Training configuration includes a batch size of 64, learning rate of 1e-6, max sequence length of 512, and 4 x H100 GPUs. η is set to 2 for Mistral data and 10 for Deepseek data.
* Hyperparameter tuning involves searching over η values {0.1, 1, 2, 5, 8, 10, 15} and learning rates {5e-6, 2e-6, 1e-6, 5e-7} using grid search.
* Three baseline models are used: ORM, Hard-Label PRM, and Soft-Label PRM.
**Phase 3:**
* Evaluation involves sampling N solutions and selecting the highest-scoring response using the trained reward model.
* RLHF is used to optimize the policy model.
* Out-of-distribution and scale analysis are performed using stronger models and different model sizes.
* Experiments are evaluated on GSM8K and MATH datasets, and results are reported with mean value ± standard deviation from 5 runs on different seeds.
### Key Observations
* The diagram provides a comprehensive overview of the reward model training pipeline.
* It covers data construction, model training, and evaluation phases.
* Specific models, datasets, and hyperparameters are mentioned.
* The process involves multiple steps of generation, completion, and reward calculation.
### Interpretation
The diagram illustrates a detailed process for training and evaluating reward models. The pipeline begins with data construction using specific models and datasets, followed by model training with defined configurations and hyperparameter tuning. Finally, the models are evaluated using various methods, including out-of-distribution and scale analysis. The use of different baseline models allows for comparison and assessment of the trained reward models. The notes section indicates that the experiments are conducted rigorously, with multiple runs and statistical reporting of the results. The overall process aims to optimize policy models using reward-based learning techniques.