\n
## Diagram: Reinforcement Learning from Human Feedback (RLHF) Pipeline
### Overview
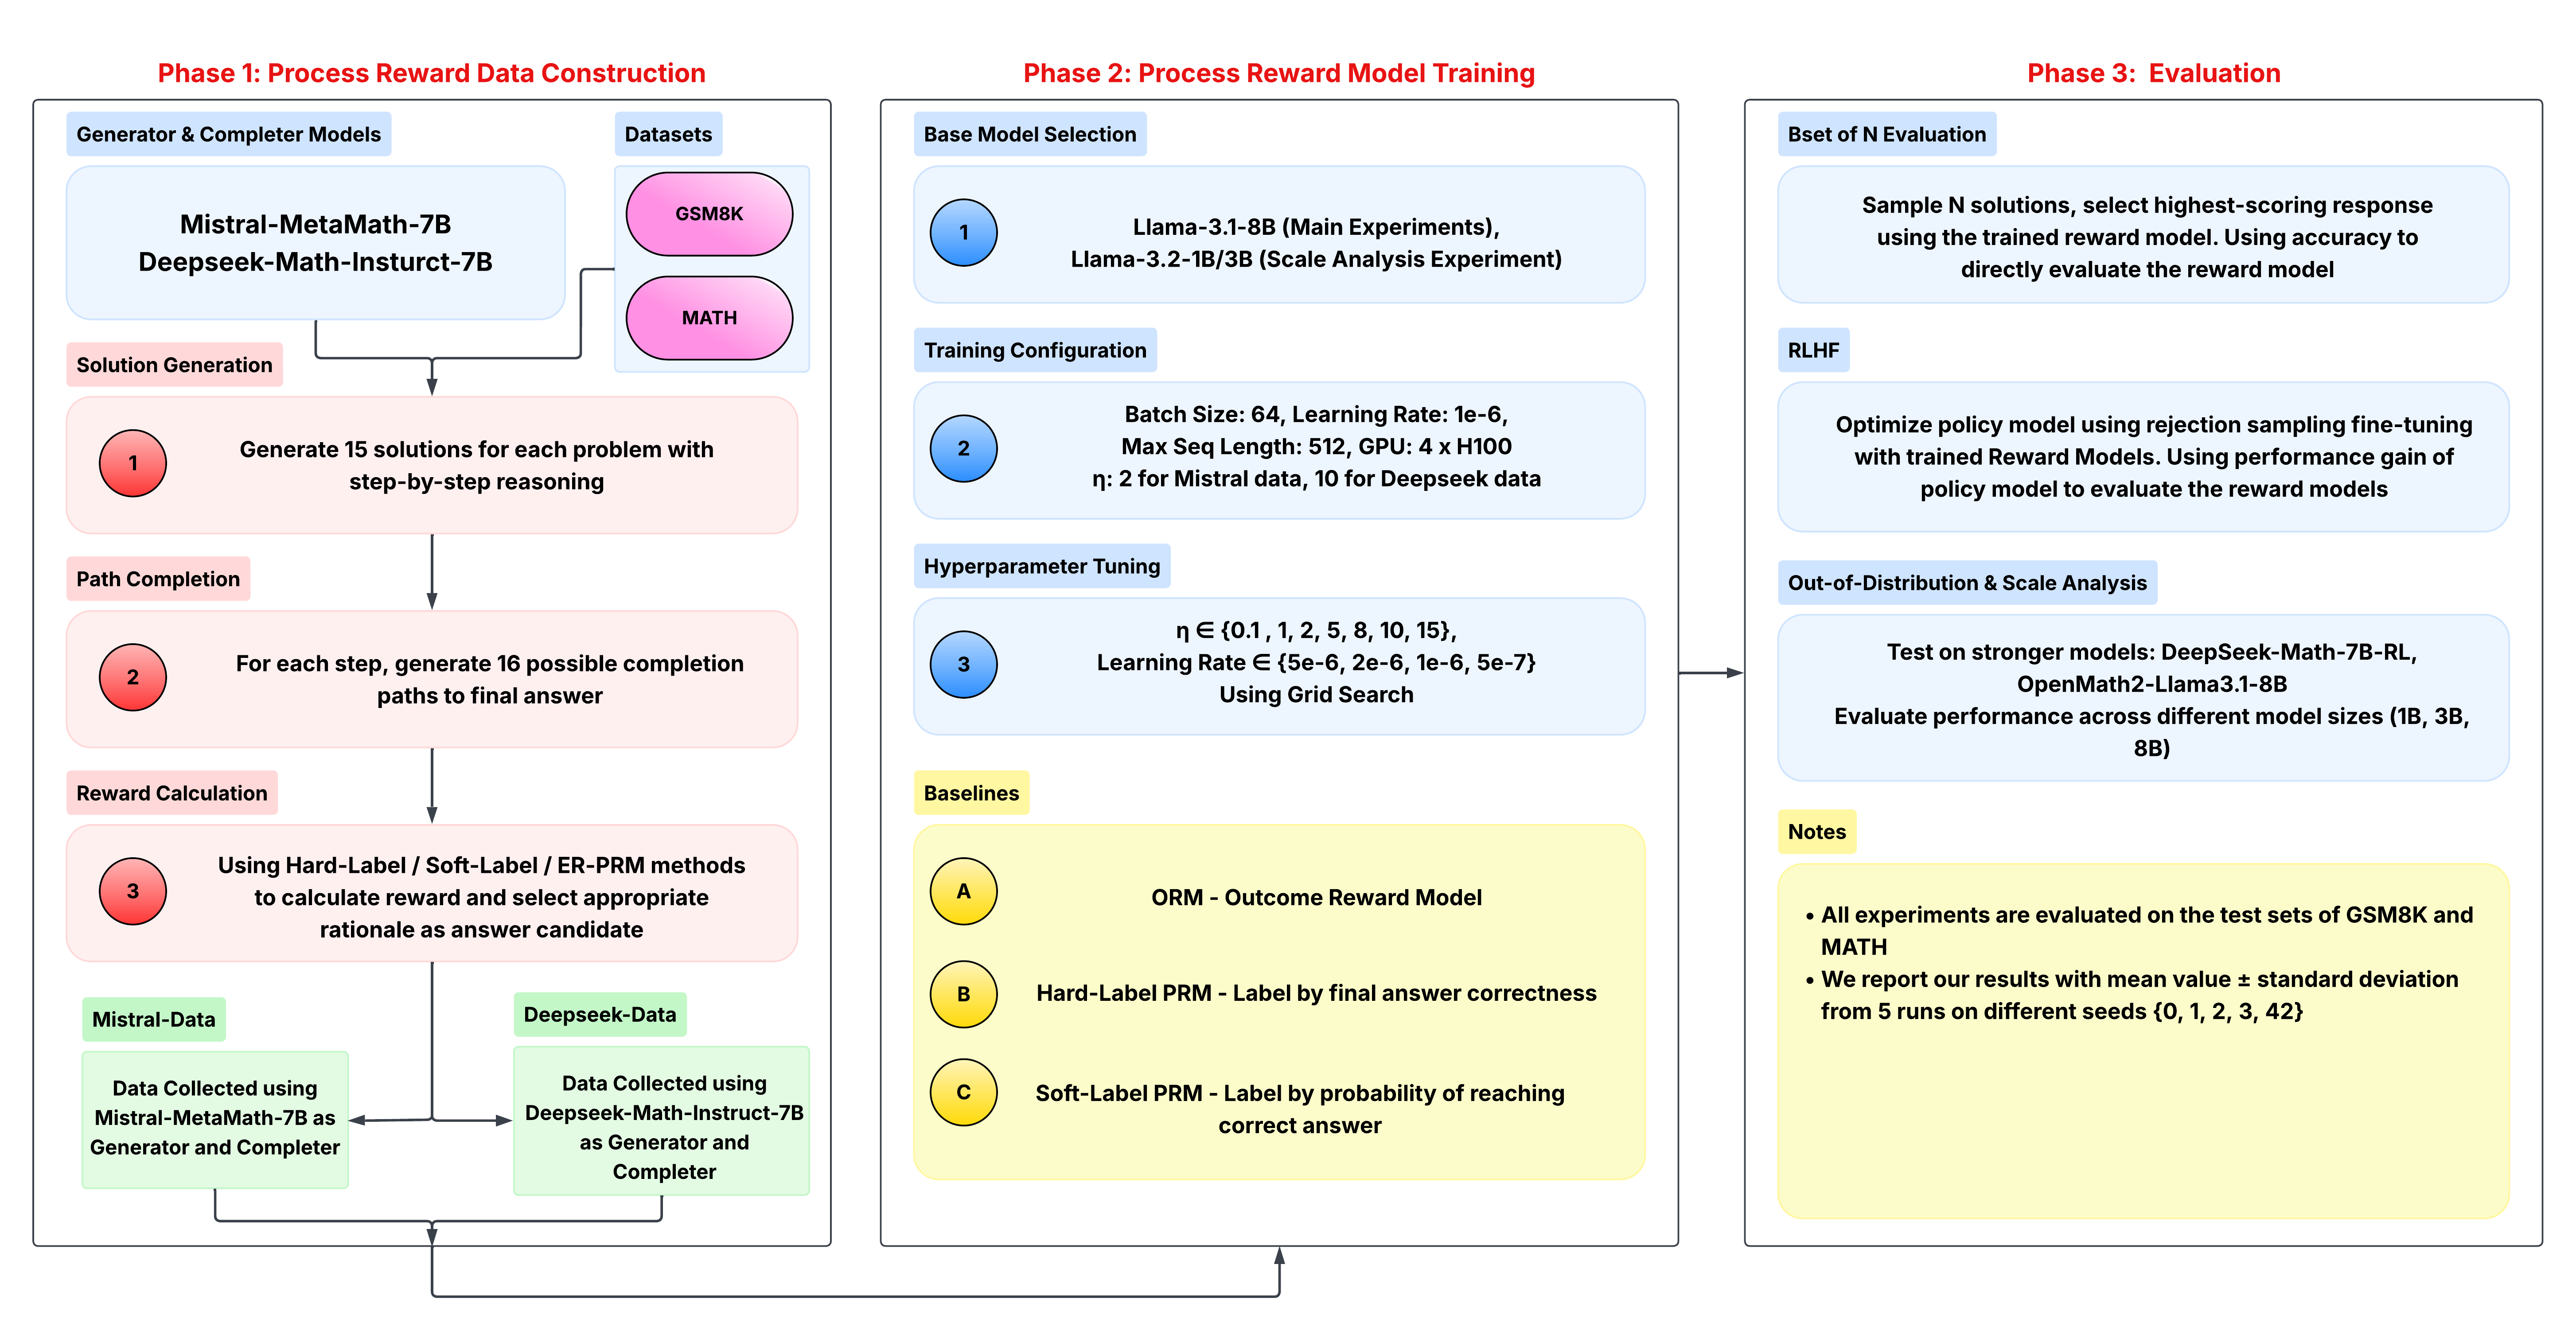
This diagram illustrates a three-phase pipeline for Reinforcement Learning from Human Feedback (RLHF). The phases are: Process Reward Data Construction, Process Reward Model Training, and Evaluation. The diagram details the models, datasets, configurations, and evaluation metrics used in each phase. Arrows indicate the flow of data and processes.
### Components/Axes
The diagram is divided into three main phases, labeled "Phase 1", "Phase 2", and "Phase 3", positioned horizontally from left to right. Each phase contains several steps represented by numbered circles (1, 2, 3) and rectangular blocks containing text descriptions. Datasets (GSM8K, MATH) are shown as rounded rectangles. Baselines are represented by circles labeled A, B, and C. A "Notes" section is present in the bottom-right corner.
### Detailed Analysis or Content Details
**Phase 1: Process Reward Data Construction**
* **Generator & Completer Models:** Mistral-MetaMath-7B and Deepseek-Math-Instruct-7B are used.
* **Datasets:** GSM8K and MATH are used.
* **Step 1 (Solution Generation):** Generate 15 solutions for each problem with step-by-step reasoning.
* **Step 2 (Path Completion):** Generate 16 possible completion paths to the final answer for each step.
* **Step 3 (Reward Calculation):** Use Hard-Label / Soft-Label / ER PRM methods to calculate reward and select appropriate rationale as answer candidate.
* **Mistral Pairs:** Data collected using Mistral-MetaMath-7B as Generator and Completer.
* **Deepseek-Data:** Data collected using Deepseek-Math-Instruct-7B as Generator and Completer.
**Phase 2: Process Reward Model Training**
* **Base Model Selection:** Llama-3-1-8B (Main Experiments), Llama-3-2-13B (Scale Analysis Experiment).
* **Training Configuration:**
* Batch Size: 64
* Learning Rate: 1e-6
* Max Seq Length: 512
* GPU: 4 x H100
* η: 2 for Mistral data, 10 for Deepseek data
* **Hyperparameter Tuning:** η ∈ {0.1, 1, 2, 5, 8, 10, 15}, Learning Rate ∈ {5e-6, 2e-6, 1e-6, 5e-7} Using Grid Search.
* **Baselines:**
* A: ORM - Outcome Reward Model
* B: Hard-Label PRM - Label by final answer correctness
* C: Soft-Label PRM - Label by probability of reaching correct answer
**Phase 3: Evaluation**
* **Best of N Evaluation:** Sample N solutions, select highest-scoring response using the trained reward model. Using accuracy to directly evaluate the reward model.
* **RLHF:** Optimize policy model using rejection sampling fine-tuning with trained Reward Models. Using performance gain of policy model to evaluate the reward models.
* **Out-of-Distribution & Scale Analysis:**
* Test on stronger models: DeepSeek-Math-7B-RL, OpenMath-Llama3-1-8B
* Evaluate performance across different model sizes (1B, 3B, 8B)
* **Notes:**
* All experiments are evaluated on the test sets of GSM8K and MATH.
* We report our results with mean ± standard deviation from 5 runs on different seeds {0, 1, 2, 3, 42}.
### Key Observations
The pipeline emphasizes a systematic approach to RLHF, starting with data generation, moving to reward model training, and culminating in rigorous evaluation. The use of multiple models (Mistral, Deepseek, Llama) and datasets (GSM8K, MATH) suggests a comprehensive evaluation strategy. The hyperparameter tuning grid search indicates a focus on optimizing the reward model's performance. The notes section highlights the importance of statistical rigor through multiple runs and reporting standard deviations.
### Interpretation
This diagram represents a standard RLHF pipeline tailored for mathematical reasoning tasks. The choice of models and datasets suggests a focus on improving the performance of language models on complex problem-solving. The pipeline's structure reflects the iterative nature of RLHF, where reward models are trained to align with human preferences and then used to refine the policy model. The inclusion of baselines (ORM, Hard-Label PRM, Soft-Label PRM) allows for a comparative assessment of the proposed approach. The evaluation phase, with its focus on out-of-distribution testing and scale analysis, demonstrates a commitment to ensuring the robustness and generalizability of the trained models. The diagram effectively communicates the key components and workflow of a sophisticated RLHF system. The use of numbered steps and clear labels enhances its readability and facilitates understanding.