## Process Flow Diagram: Process Reward Model (PRM) Training Pipeline
### Overview
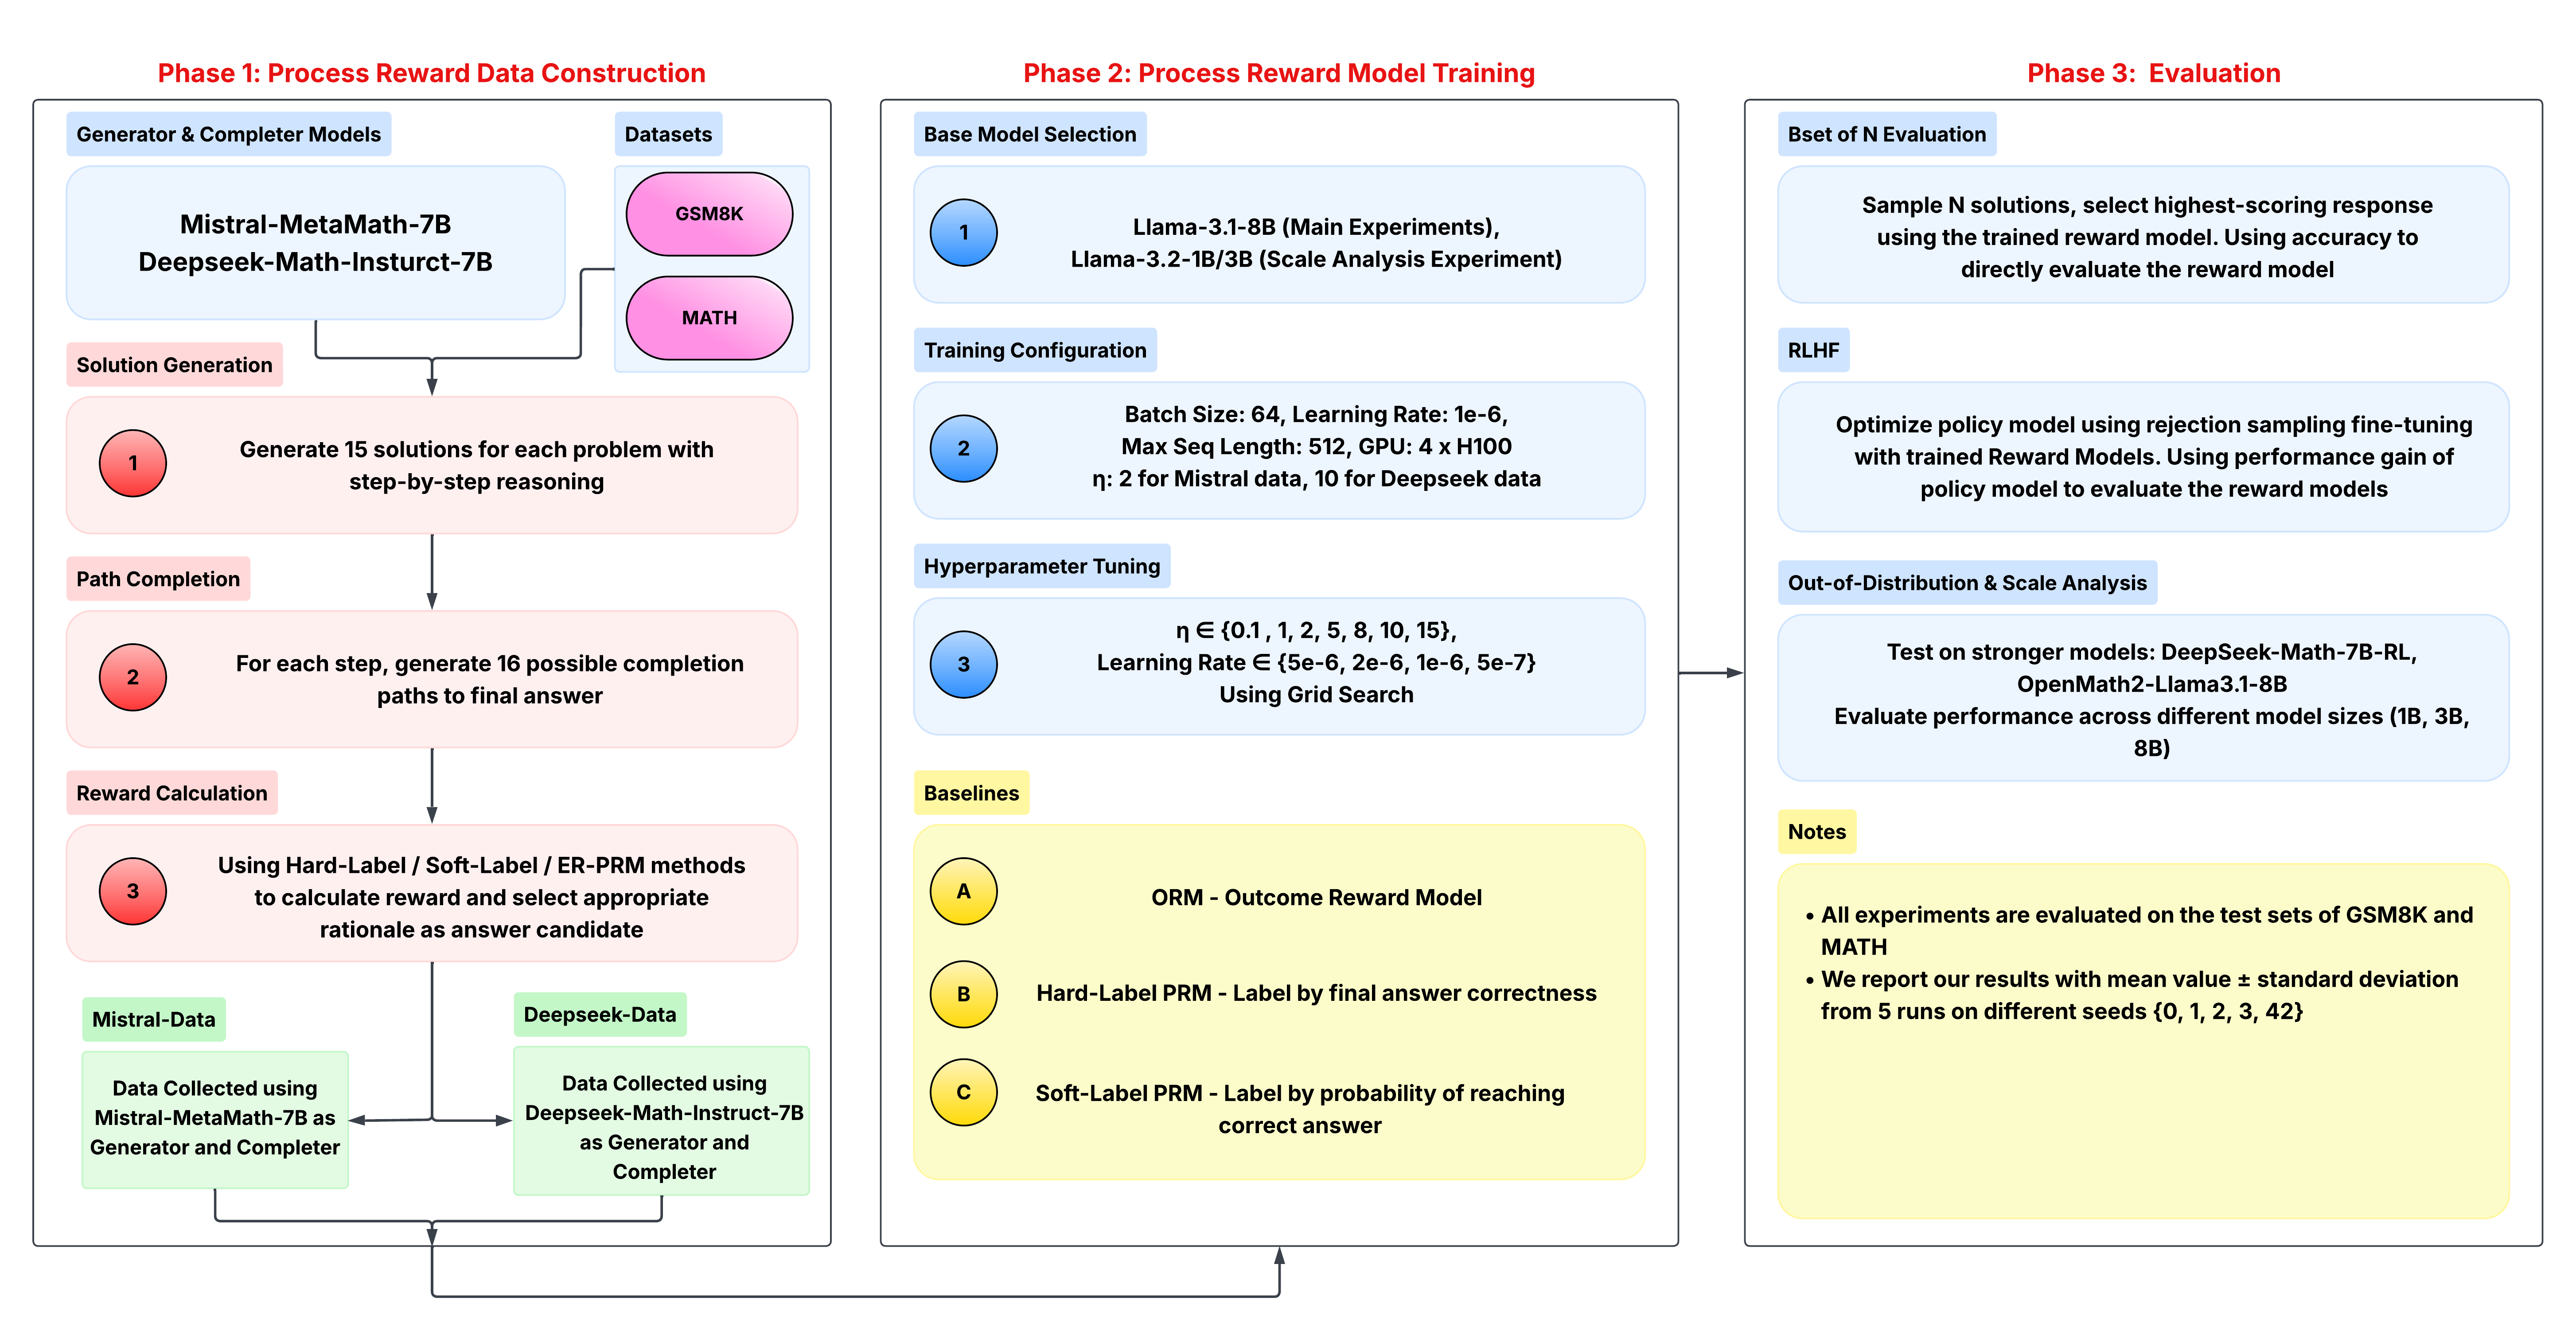
This image is a technical process flow diagram detailing a three-phase pipeline for constructing, training, and evaluating a Process Reward Model (PRM) for mathematical reasoning. The diagram is structured into three main vertical panels, each representing a distinct phase, with internal components connected by arrows indicating workflow and data flow.
### Components/Axes
The diagram is divided into three primary phases, labeled at the top in red text:
1. **Phase 1: Process Reward Data Construction** (Left panel)
2. **Phase 2: Process Reward Model Training** (Center panel)
3. **Phase 3: Evaluation** (Right panel)
Each phase contains several labeled subsections and process steps, color-coded for clarity:
* **Light Blue Boxes:** Model names, dataset names, and configuration titles.
* **Pink Boxes:** Process steps within Phase 1.
* **Yellow Boxes:** Baseline models and notes.
* **Numbered Circles (Red in Phase 1, Blue in Phase 2):** Sequential steps within a phase.
* **Letter Circles (Yellow in Phase 2):** Baseline model identifiers (A, B, C).
### Detailed Analysis
#### **Phase 1: Process Reward Data Construction**
This phase details the creation of training data for the reward model.
* **Generator & Completer Models:** Two models are specified: `Mistral-MetaMath-7B` and `Deepseek-Math-Instruct-7B`.
* **Datasets:** Two datasets are used: `GSM8K` and `MATH`.
* **Process Steps:**
1. **Solution Generation:** "Generate 15 solutions for each problem with step-by-step reasoning."
2. **Path Completion:** "For each step, generate 16 possible completion paths to final answer."
3. **Reward Calculation:** "Using Hard-Label / Soft-Label / ER-PRM methods to calculate reward and select appropriate rationale as answer candidate."
* **Data Collection Outputs:** The process results in two distinct datasets:
* **Mistral-Data:** "Data Collected using Mistral-MetaMath-7B as Generator and Completer."
* **Deepseek-Data:** "Data Collected using Deepseek-Math-Instruct-7B as Generator and Completer."
#### **Phase 2: Process Reward Model Training**
This phase outlines the training setup for the reward model.
* **Base Model Selection:**
* Step 1: `Llama-3.1-8B (Main Experiments)`, `Llama-3.2-1B/3B (Scale Analysis Experiment)`.
* **Training Configuration:**
* Step 2: `Batch Size: 64, Learning Rate: 1e-6, Max Seq Length: 512, GPU: 4 x H100`.
* `η: 2 for Mistral data, 10 for Deepseek data` (where η is likely a hyperparameter).
* **Hyperparameter Tuning:**
* Step 3: `η ∈ {0.1, 1, 2, 5, 8, 10, 15}, Learning Rate ∈ {5e-6, 2e-6, 1e-6, 5e-7} Using Grid Search`.
* **Baselines:** Three baseline models are defined for comparison:
* **A:** `ORM - Outcome Reward Model`
* **B:** `Hard-Label PRM - Label by final answer correctness`
* **C:** `Soft-Label PRM - Label by probability of reaching correct answer`
#### **Phase 3: Evaluation**
This phase describes the methods for evaluating the trained reward model.
* **Best of N Evaluation:** "Sample N solutions, select highest-scoring response using the trained reward model. Using accuracy to directly evaluate the reward model." (Note: The label contains a typo, "Bset" instead of "Best").
* **RLHF:** "Optimize policy model using rejection sampling fine-tuning with trained Reward Models. Using performance gain of policy model to evaluate the reward models."
* **Out-of-Distribution & Scale Analysis:** "Test on stronger models: DeepSeek-Math-7B-RL, OpenMath2-Llama3.1-8B. Evaluate performance across different model sizes (1B, 3B, 8B)."
* **Notes:**
* "All experiments are evaluated on the test sets of GSM8K and MATH."
* "We report our results with mean value ± standard deviation from 5 runs on different seeds {0, 1, 2, 3, 42}."
### Key Observations
1. **Modular Pipeline:** The process is clearly segmented into data creation, model training, and evaluation, allowing for independent modification of each stage.
2. **Data Diversity:** Training data is generated using two different base models (Mistral and Deepseek), potentially to increase robustness or study model-specific effects.
3. **Comprehensive Evaluation:** The evaluation strategy is multi-faceted, including direct accuracy (Best-of-N), downstream utility (RLHF), and robustness tests (OOD and scale analysis).
4. **Reproducibility Focus:** The notes explicitly state the use of multiple random seeds and the reporting of mean ± standard deviation, emphasizing statistical rigor.
5. **Baseline Comparison:** The inclusion of ORM and different PRM labeling schemes (Hard vs. Soft) suggests the study aims to benchmark the proposed method against standard approaches.
### Interpretation
This diagram represents a sophisticated methodology for improving the step-by-step reasoning of large language models (LLMs) in mathematics. The core idea is to train a **Process Reward Model (PRM)** that can evaluate the quality of each reasoning step, not just the final answer.
* **How it works:** The pipeline first generates a large dataset of reasoning paths (Phase 1), labeling each step with a reward signal. This data is then used to train a separate model (Phase 2) to predict these rewards. Finally, this reward model is used to select the best reasoning path from multiple candidates (Best-of-N) or to fine-tune a policy model via RLHF (Phase 3).
* **Significance:** This approach addresses a key limitation of Outcome Reward Models (ORMs), which only judge the final answer. By providing feedback on intermediate steps, a PRM can guide the model towards more reliable and interpretable reasoning chains, potentially reducing errors and "hallucinated" logic.
* **Underlying Goal:** The entire framework is designed to systematically investigate the effectiveness of process-based supervision. The scale analysis (testing 1B, 3B, 8B models) and OOD testing indicate the researchers are interested in how this technique generalizes across model sizes and domains. The comparison between Hard-Label and Soft-Label PRMs seeks to understand the optimal way to assign credit to individual reasoning steps.