## Line Chart: ε vs Gradient Updates
### Overview
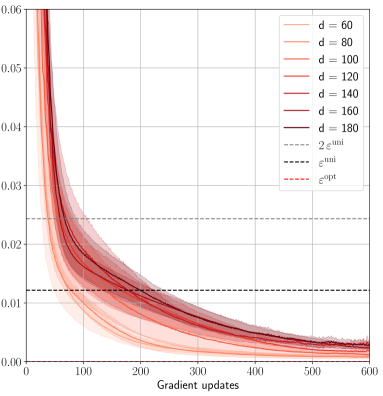
The chart displays the convergence behavior of a parameter ε (epsilon) across multiple gradient update steps (0–600). Seven distinct lines represent different values of a parameter "d" (60, 80, 100, 120, 140, 160, 180), with shaded confidence intervals. Two horizontal reference lines (2ε_uni and ε_opt) are included for comparison.
### Components/Axes
- **X-axis**: Gradient updates (0–600, linear scale)
- **Y-axis**: ε values (0.00–0.06, logarithmic-like decay)
- **Legend**:
- Solid lines: d = 60 (light orange), 80 (orange), 100 (light red), 120 (red), 140 (dark red), 160 (maroon), 180 (dark maroon)
- Dashed lines: 2ε_uni (gray), ε_opt (red dashed)
- **Shading**: Confidence intervals (light gray bands) around each line
### Detailed Analysis
1. **d = 60–180 Lines**:
- All lines start near ε ≈ 0.06 at 0 gradient updates.
- Lines exhibit exponential decay, with higher "d" values showing slower convergence.
- Example: d=180 (dark maroon) retains ε ≈ 0.03 at 600 updates, while d=60 (light orange) drops below 0.01.
- Confidence intervals widen initially (first 100 updates) and narrow as updates increase.
2. **Reference Lines**:
- 2ε_uni (gray dashed): Horizontal line at ε ≈ 0.01.
- ε_opt (red dashed): Horizontal line at ε ≈ 0.02.
3. **Convergence Patterns**:
- Lines for d=60–100 cross below ε_opt (~0.02) by ~200 updates.
- d=120–180 lines remain above ε_opt throughout, approaching 2ε_uni asymptotically.
### Key Observations
- **Inverse Relationship**: Higher "d" values correlate with slower ε decay (e.g., d=180 vs. d=60).
- **Threshold Behavior**: All lines eventually approach 2ε_uni, suggesting a universal lower bound.
- **Optimal ε Gap**: ε_opt (0.02) lies between 2ε_uni (0.01) and the final ε values of d=120–180.
### Interpretation
The data demonstrates that increasing "d" (possibly model complexity or dataset size) delays ε convergence, requiring more gradient updates to achieve lower error rates. The ε_opt line suggests a practical target for balancing performance and computational cost, while 2ε_uni represents a theoretical minimum. The widening confidence intervals at early updates indicate higher variability in initial training phases, which stabilizes as training progresses. This pattern implies that larger "d" systems may require specialized optimization strategies to efficiently reach ε_opt.