\n
## Diagram: Hugging Face Ecosystem & BERT Pre-training Flow
### Overview
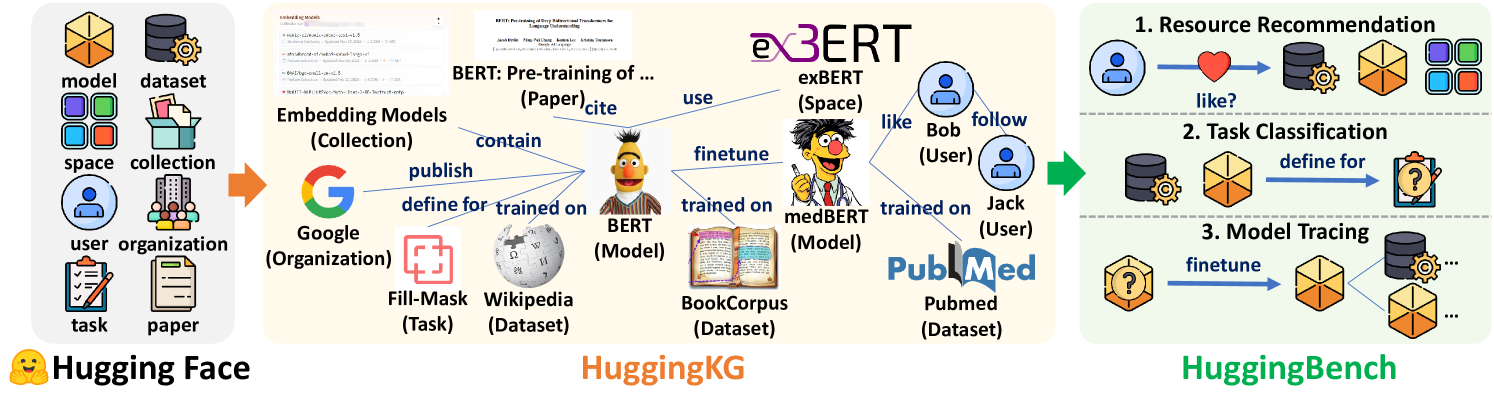
This diagram illustrates the relationships between various components within the Hugging Face ecosystem, focusing on the pre-training and fine-tuning of BERT models. It depicts a flow of information and dependencies between datasets, models, organizations, users, and spaces. The diagram is segmented into three main sections: Hugging Face (left), HuggingKG (center), and HuggingBench (right). Arrows indicate the direction of influence or usage.
### Components/Axes
The diagram features several key components:
* **Hugging Face (Left):** Includes elements like "model", "dataset", "space", "collection", "user organization", "task", and "paper".
* **HuggingKG (Center):** Contains "Embedding Models", "Google (Organization)", "Fill-Mask (Task)", "Wikipedia (Dataset)", "BERT (Model)", "BookCorpus (Dataset)", and "PubMed (Dataset)".
* **HuggingBench (Right):** Features "Resource Recommendation", "Task Classification", and "Model Tracing".
* **Users:** "Bob" and "Jack" are explicitly named users.
* **Models:** "eBERT", "medBERT"
* **Relationships:** Arrows labeled with actions like "use", "finetune", "define for", "trained on", "contain", "publish", and "like/follow".
* **Logos:** Hugging Face, Google, PubMed logos are present.
* **Text Snippets:** A small text snippet resembling code or a log is visible within the "Embedding Models" section. A paper citation is also visible.
### Detailed Analysis or Content Details
**Hugging Face (Left):**
* A cylinder labeled "model" is connected to a collection of cubes labeled "dataset".
* A cube labeled "space" is connected to the "collection".
* Two figures representing a "user organization" are connected to the "collection" via a red arrow.
* A notepad labeled "task" and a stack of papers labeled "paper" are also connected to the "collection".
**HuggingKG (Center):**
* "Embedding Models" (Collection) contains a snippet of text that appears to be code or a log file. The text is partially visible: "BERT: Pre-training of ... (Paper)cite".
* A "G" logo representing "Google (Organization)" publishes "Fill-Mask (Task)".
* "Fill-Mask (Task)" is used to train "BERT (Model)".
* "BERT (Model)" is trained on "Wikipedia (Dataset)" and "BookCorpus (Dataset)".
* "medBERT (Model)" is trained on "PubMed (Dataset)".
* "eBERT (Space)" is used by "Bob (User)" who likes and follows it.
* "Jack (User)" trains "medBERT (Model)" on "PubMed (Dataset)".
**HuggingBench (Right):**
* **Resource Recommendation:** A series of icons (people, gears, etc.) are connected by arrows labeled "like?".
* **Task Classification:** A cube labeled with a gear icon is connected to a question mark icon via an arrow labeled "define for".
* **Model Tracing:** A question mark icon is connected to a series of cubes via an arrow labeled "finetune".
### Key Observations
* The diagram emphasizes the flow of data and models from foundational datasets (Wikipedia, BookCorpus, PubMed) through pre-training (BERT, medBERT, eBERT) to user applications and recommendations.
* The use of color-coded arrows (red, blue, green) suggests different types of relationships or data flows.
* The presence of specific users ("Bob", "Jack") indicates a focus on personalized model usage and feedback.
* The "Hugging Face" section acts as a source of data and tasks, while "HuggingBench" represents the application and evaluation of models.
* The diagram highlights the iterative nature of model development, with fine-tuning being a key step.
### Interpretation
The diagram illustrates the core functionality of the Hugging Face ecosystem: providing a platform for sharing, training, and deploying machine learning models, particularly those based on the BERT architecture. The flow of information from datasets to models to users demonstrates a collaborative and iterative process. The diagram suggests that Hugging Face aims to democratize access to advanced NLP models by providing tools and resources for both researchers and developers.
The segmentation into Hugging Face, HuggingKG, and HuggingBench represents a logical division of labor: data and task creation, knowledge representation and model training, and model evaluation and deployment. The inclusion of specific users like "Bob" and "Jack" suggests a focus on personalization and user engagement. The "like" and "follow" actions indicate a social aspect to the platform, where users can discover and endorse useful models.
The diagram doesn't provide specific numerical data or performance metrics. It is a conceptual overview of the ecosystem's architecture and workflow. The diagram is a high-level representation of the ecosystem, and further details would be needed to understand the specific algorithms, datasets, and models involved.