# Technical Data Extraction: Unit Ratio Comparison
## 1. Document Overview
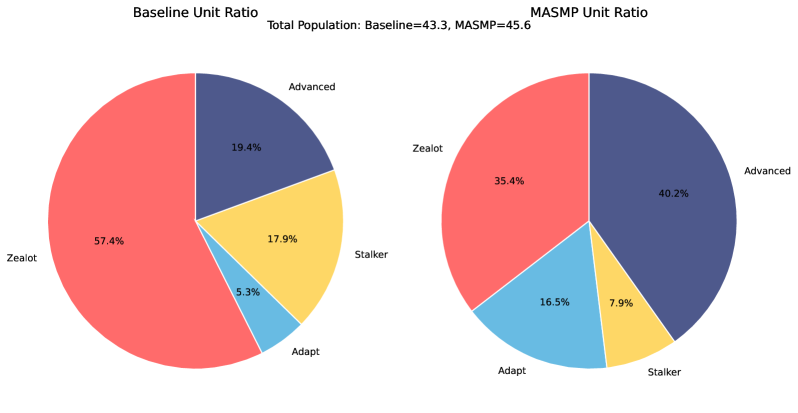
This image contains two side-by-side pie charts comparing unit compositions between two different scenarios: **Baseline** and **MASMP**. The data relates to real-time strategy game unit compositions (specifically Protoss units from StarCraft II).
### Header Information
- **Main Title (Center):** Total Population: Baseline=43.3, MASMP=45.6
- **Left Chart Title:** Baseline Unit Ratio
- **Right Chart Title:** MASMP Unit Ratio
---
## 2. Component Isolation & Data Extraction
### Region A: Baseline Unit Ratio (Left Chart)
**Total Population Context:** 43.3
| Unit Category | Color | Percentage | Visual Trend/Placement |
| :--- | :--- | :--- | :--- |
| **Zealot** | Red/Salmon | 57.4% | Largest slice; spans from ~6 o'clock to ~12 o'clock. |
| **Advanced** | Dark Blue/Purple | 19.4% | Second largest; located in the top right quadrant. |
| **Stalker** | Yellow/Gold | 17.9% | Third largest; located in the bottom right quadrant. |
| **Adapt** | Light Blue | 5.3% | Smallest slice; located between Zealot and Stalker. |
### Region B: MASMP Unit Ratio (Right Chart)
**Total Population Context:** 45.6
| Unit Category | Color | Percentage | Visual Trend/Placement |
| :--- | :--- | :--- | :--- |
| **Advanced** | Dark Blue/Purple | 40.2% | Largest slice; spans from ~12 o'clock to ~4 o'clock. |
| **Zealot** | Red/Salmon | 35.4% | Second largest; spans from ~8 o'clock to ~12 o'clock. |
| **Adapt** | Light Blue | 16.5% | Third largest; located in the bottom left quadrant. |
| **Stalker** | Yellow/Gold | 7.9% | Smallest slice; located in the bottom right quadrant. |
---
## 3. Comparative Analysis & Key Trends
By comparing the two charts, the following shifts in unit composition are observed:
1. **Advanced Units:** Show the most significant growth, increasing from **19.4%** in Baseline to **40.2%** in MASMP (a +20.8 percentage point increase).
2. **Zealots:** Show a significant decrease, dropping from **57.4%** in Baseline to **35.4%** in MASMP (a -22.0 percentage point decrease).
3. **Adapts:** Show a notable increase in presence, growing from **5.3%** to **16.5%** (+11.2 percentage points).
4. **Stalkers:** Show a decrease in presence, dropping from **17.9%** to **7.9%** (-10.0 percentage points).
5. **Total Population:** The MASMP scenario has a slightly higher total population (**45.6**) compared to the Baseline (**43.3**).
## 4. Text Transcription Summary
- **Titles:** "Baseline Unit Ratio", "MASMP Unit Ratio", "Total Population: Baseline=43.3, MASMP=45.6"
- **Labels:** "Zealot", "Advanced", "Stalker", "Adapt"
- **Values:** "57.4%", "19.4%", "17.9%", "5.3%", "35.4%", "40.2%", "7.9%", "16.5%"