# Technical Document Extraction: Unit Ratio Analysis
## Image Description
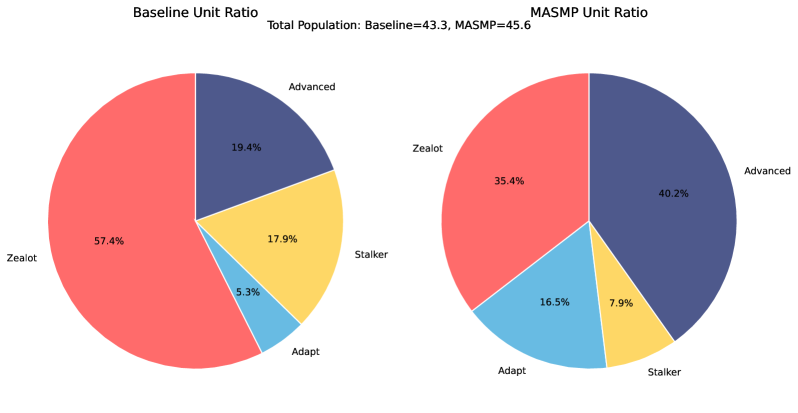
The image contains two pie charts comparing unit ratios for two systems: "Baseline Unit Ratio" and "MASMP Unit Ratio". Both charts include percentage distributions across four categories: Zealot, Advanced, Stalker, and Adapt. Color-coded legends are present for each category.
---
### **Baseline Unit Ratio**
- **Total Population**: 43.3
- **Categories**:
- **Zealot**: 57.4% (Red)
- **Advanced**: 19.4% (Dark Blue)
- **Stalker**: 17.9% (Yellow)
- **Adapt**: 5.3% (Light Blue)
### **MASMP Unit Ratio**
- **Total Population**: 45.6
- **Categories**:
- **Zealot**: 35.4% (Red)
- **Advanced**: 40.2% (Dark Blue)
- **Stalker**: 7.9% (Yellow)
- **Adapt**: 16.5% (Light Blue)
---
### **Key Observations**
1. **Baseline System**:
- Zealot dominates with 57.4% of the population.
- Adapt is the smallest category at 5.3%.
- Stalker and Advanced are intermediate, with 17.9% and 19.4%, respectively.
2. **MASMP System**:
- Advanced becomes the largest category at 40.2%.
- Zealot decreases to 35.4% compared to Baseline.
- Adapt increases significantly to 16.5%.
- Stalker is the smallest at 7.9%.
---
### **Legend and Color Mapping**
- **Zealot**: Red (#FF0000)
- **Advanced**: Dark Blue (#00008B)
- **Stalker**: Yellow (#FFFF00)
- **Adapt**: Light Blue (#ADD8E6)
---
### **Spatial Grounding**
- **Baseline Chart**:
- Zealot (Red) occupies the largest segment.
- Adapt (Light Blue) is the smallest, positioned at the bottom.
- **MASMP Chart**:
- Advanced (Dark Blue) is the largest segment.
- Stalker (Yellow) is the smallest, positioned at the bottom.
---
### **Trend Verification**
- **Baseline**:
- Zealot > Stalker > Advanced > Adapt (by percentage).
- **MASMP**:
- Advanced > Zealot > Adapt > Stalker (by percentage).
---
### **Conclusion**
The MASMP system shows a shift in unit distribution compared to Baseline, with Advanced units increasing and Stalker units decreasing. Adapt units show the most significant growth in MASMP. All data is presented in English.