\n
## Line Chart: Proportion of Flips vs. Iterations (Qwen2.5-3B)
### Overview
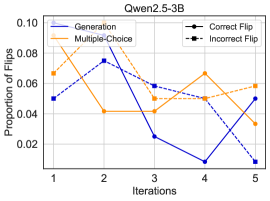
This image presents a line chart illustrating the proportion of flips across different iterations for various methods: Generation, Multiple-Choice, Correct Flip, and Incorrect Flip. The chart appears to be evaluating the performance of a model (Qwen2.5-3B) over five iterations.
### Components/Axes
* **Title:** Qwen2.5-3B (positioned at the top-center)
* **X-axis:** Iterations (labeled 1 to 5, with equal spacing)
* **Y-axis:** Proportion of Flips (scale ranging from 0.00 to 0.10, with increments of 0.02)
* **Legend:** Located at the top-right corner, containing the following labels and corresponding line styles/colors:
* Generation (solid blue line)
* Multiple-Choice (solid orange line)
* Correct Flip (solid black line with circular markers)
* Incorrect Flip (dashed black line with square markers)
### Detailed Analysis
The chart displays five data series, each representing a different method.
* **Generation (Blue Line):** The line starts at approximately 0.065 at Iteration 1, rises to a peak of approximately 0.08 at Iteration 2, then sharply declines to approximately 0.02 at Iteration 3. It continues to decrease to approximately 0.01 at Iteration 4, and finally rises slightly to approximately 0.03 at Iteration 5.
* **Multiple-Choice (Orange Line):** The line begins at approximately 0.08 at Iteration 1, drops to approximately 0.04 at Iteration 2, remains relatively stable at approximately 0.04 to 0.05 through Iteration 3, increases to approximately 0.065 at Iteration 4, and then decreases to approximately 0.06 at Iteration 5.
* **Correct Flip (Black Line with Circles):** The line starts at approximately 0.055 at Iteration 1, rises to approximately 0.07 at Iteration 2, decreases to approximately 0.055 at Iteration 3, increases to approximately 0.06 at Iteration 4, and then decreases to approximately 0.04 at Iteration 5.
* **Incorrect Flip (Dashed Black Line with Squares):** The line begins at approximately 0.05 at Iteration 1, rises to approximately 0.06 at Iteration 2, decreases to approximately 0.05 at Iteration 3, increases to approximately 0.055 at Iteration 4, and then increases to approximately 0.06 at Iteration 5.
### Key Observations
* The "Generation" method exhibits the most significant fluctuation, with a substantial drop in the proportion of flips between Iteration 2 and Iteration 3.
* The "Multiple-Choice" method shows a relatively stable trend, with a slight increase towards the end of the iterations.
* "Correct Flip" and "Incorrect Flip" methods show relatively stable trends, with minor fluctuations throughout the iterations.
* The "Generation" method starts with a relatively high proportion of flips, but this decreases significantly over the iterations.
### Interpretation
The chart suggests that the "Generation" method initially shows a higher rate of flips, potentially indicating a greater degree of exploration or change in the generated outputs. However, this rate decreases substantially over the iterations, possibly indicating convergence or a reduction in variability. The "Multiple-Choice" method maintains a more consistent proportion of flips, suggesting a more stable performance. The "Correct Flip" and "Incorrect Flip" methods provide a baseline for comparison, showing relatively stable rates of flips.
The data implies that the model (Qwen2.5-3B) undergoes a period of significant adjustment in the early iterations, particularly when using the "Generation" method. The subsequent stabilization of the "Multiple-Choice" method suggests that it may be more robust or less sensitive to the initial conditions. The overall trend indicates that the model is learning and adapting over the iterations, as evidenced by the changes in the proportion of flips. The differences between the methods could be due to the different approaches used for generating or evaluating the outputs.