## Line Chart: Qwen2.5-3B - Proportion of Flips Over Iterations
### Overview
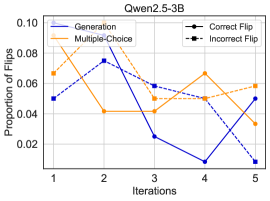
The image is a line chart titled "Qwen2.5-3B". It plots the "Proportion of Flips" against "Iterations" for two distinct methods: "Generation" and "Multiple-Choice". The chart tracks how the proportion of flips changes over five iterations for each method, with line style (solid vs. dashed) indicating whether the flip was "Correct" or "Incorrect".
### Components/Axes
* **Title:** "Qwen2.5-3B" (centered at the top).
* **Y-Axis:**
* **Label:** "Proportion of Flips" (vertical text on the left).
* **Scale:** Linear scale from 0.02 to 0.10, with major tick marks at 0.02, 0.04, 0.06, 0.08, and 0.10.
* **X-Axis:**
* **Label:** "Iterations" (horizontal text at the bottom).
* **Scale:** Discrete integer values from 1 to 5.
* **Legend:** Positioned in the top-right corner of the plot area.
* **Series 1:** "Generation" - Represented by a blue line with circular markers.
* **Series 2:** "Multiple-Choice" - Represented by an orange line with square markers.
* **Line Style Key:**
* "Correct Flip" - Indicated by a solid line segment.
* "Incorrect Flip" - Indicated by a dashed line segment.
* **Data Series:** Two lines, each composed of four segments connecting five data points. The style of each segment (solid/dashed) corresponds to the flip correctness for that interval.
### Detailed Analysis
**1. Generation (Blue Line, Circular Markers):**
* **Trend:** The line shows high volatility. It rises sharply to a peak, then declines steeply before a final partial recovery.
* **Data Points & Segment Analysis:**
* Iteration 1: Value ≈ 0.050.
* Segment 1→2: **Solid line** (Correct Flip). Value rises to a peak at Iteration 2 ≈ 0.080.
* Segment 2→3: **Dashed line** (Incorrect Flip). Value drops sharply to Iteration 3 ≈ 0.025.
* Segment 3→4: **Solid line** (Correct Flip). Value continues to drop to its lowest point at Iteration 4 ≈ 0.010.
* Segment 4→5: **Dashed line** (Incorrect Flip). Value recovers to Iteration 5 ≈ 0.050.
**2. Multiple-Choice (Orange Line, Square Markers):**
* **Trend:** The line shows a more moderate, undulating pattern with a mid-chart dip and a later peak.
* **Data Points & Segment Analysis:**
* Iteration 1: Value ≈ 0.065.
* Segment 1→2: **Solid line** (Correct Flip). Value drops to Iteration 2 ≈ 0.040.
* Segment 2→3: **Dashed line** (Incorrect Flip). Value remains stable at Iteration 3 ≈ 0.040.
* Segment 3→4: **Solid line** (Correct Flip). Value rises to a peak at Iteration 4 ≈ 0.065.
* Segment 4→5: **Dashed line** (Incorrect Flip). Value drops to Iteration 5 ≈ 0.035.
### Key Observations
1. **Volatility Contrast:** The "Generation" method exhibits significantly higher volatility, with a range of approximately 0.070 (from ~0.010 to ~0.080). The "Multiple-Choice" method is more stable, with a range of approximately 0.030 (from ~0.035 to ~0.065).
2. **Peak Timing:** The two methods peak at different iterations. "Generation" peaks early at Iteration 2, while "Multiple-Choice" peaks later at Iteration 4.
3. **Final Convergence:** By Iteration 5, both methods converge to a similar proportion of flips (~0.050 for Generation, ~0.035 for Multiple-Choice), though Generation ends on an upward trend and Multiple-Choice on a downward one.
4. **Flip Correctness Pattern:** For both methods, the segments between iterations alternate between solid (Correct) and dashed (Incorrect). This suggests a pattern where a correct flip is followed by an incorrect one, and vice-versa, across the measured intervals.
### Interpretation
This chart likely evaluates the behavior of the Qwen2.5-3B model under two different prompting or evaluation strategies ("Generation" vs. "Multiple-Choice") over a series of iterative steps. The "Proportion of Flips" probably measures the rate at which the model changes its output or answer between iterations.
* **Method Comparison:** The "Generation" approach appears to induce more dramatic changes in the model's outputs, leading to both higher peaks of change and deeper troughs of stability. This could indicate a more exploratory or unstable process. The "Multiple-Choice" approach results in more measured, consistent changes, suggesting a more constrained or conservative evaluation process.
* **Correctness Oscillation:** The alternating solid/dashed pattern is a critical finding. It implies that for both methods, the model's tendency to make a *correct* flip versus an *incorrect* flip is not random but follows a sequential pattern over these iterations. A correct adjustment is often followed by an incorrect one, and vice-versa, which may point to an underlying oscillatory dynamic in the model's refinement process.
* **Convergence vs. Divergence:** While both methods start and end at somewhat similar levels, their paths are distinct. The final upward tick for "Generation" versus the downward tick for "Multiple-Choice" suggests their long-term trajectories might continue to diverge if iterations were extended. The data does not show a clear convergence to a stable, low flip rate for either method within five iterations.