## Diagram: State, Step, and Verification Process
### Overview
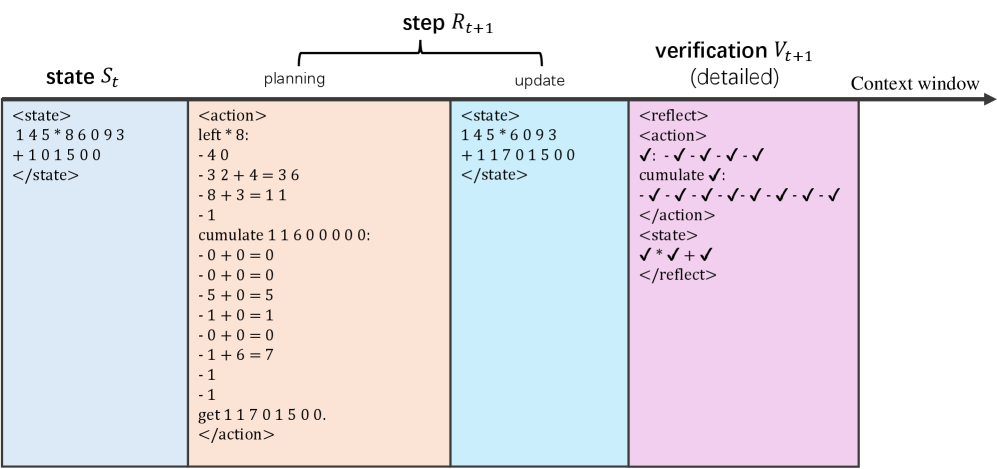
The image depicts a diagram illustrating a process involving a state, a step, and verification, within a context window. The process is divided into three main phases: "state St", "step Rt+1" (further divided into "planning" and "update"), and "verification Vt+1 (detailed)". Each phase contains specific actions or data transformations.
### Components/Axes
* **Horizontal Axis:** Represents the "Context window" and implies a temporal progression from left to right.
* **Vertical Sections:**
* **State St (Leftmost, Blue):** Represents the initial state, containing numerical data.
* **Step Rt+1 (Middle, Orange and Light Blue):** Divided into "planning" (Orange) and "update" (Light Blue) phases, showing actions and state modifications.
* **Verification Vt+1 (Rightmost, Pink):** Represents the verification phase, containing checks and reflections.
### Detailed Analysis
**1. State St (Blue Section):**
* Contains the following text within `<state>` tags:
* `145*86093`
* `+101500`
**2. Step Rt+1 (Orange and Light Blue Sections):**
* **Planning (Orange Section):**
* Contains the following text within `<action>` tags:
* `left * 8:`
* `- 40`
* `-32+4=36`
* `-8+3=11`
* `-1`
* `cumulate 1 1600000:`
* `-0+0=0`
* `-0+0=0`
* `-5+0=5`
* `-1+0=1`
* `-0+0=0`
* `-1+6=7`
* `-1`
* `-1`
* `get 11701500.`
* **Update (Light Blue Section):**
* Contains the following text within `<state>` tags:
* `145*6093`
* `+11701500`
**3. Verification Vt+1 (Pink Section):**
* Contains the following text within `<reflect>` tags:
* `<action>`
* `√:-√-√-√-√`
* `cumulate √:`
* `-√-√-√-√-√-√-√-√`
* `</action>`
* `<state>`
* `√*√+√`
* `</reflect>`
### Key Observations
* The diagram illustrates a sequential process, moving from an initial state through planning and update steps to a final verification stage.
* The "step" phase is divided into "planning" and "update," suggesting a two-stage process for modifying the state.
* The verification phase uses checkmarks (√) and other symbols to indicate the results of the verification process.
### Interpretation
The diagram likely represents a simplified model of a computational or decision-making process. The "state" represents the current data or situation, the "step" represents actions taken to modify the state, and the "verification" represents checks to ensure the actions were valid or successful. The "context window" suggests that this process is part of a larger sequence or system. The specific numerical values and operations within each phase would need further context to fully understand their meaning. The use of `<state>`, `<action>`, and `<reflect>` tags suggests a structured data format or programming paradigm.