\n
## Line Chart: I-Don't-Know Rate vs. Layer for Llama Models
### Overview
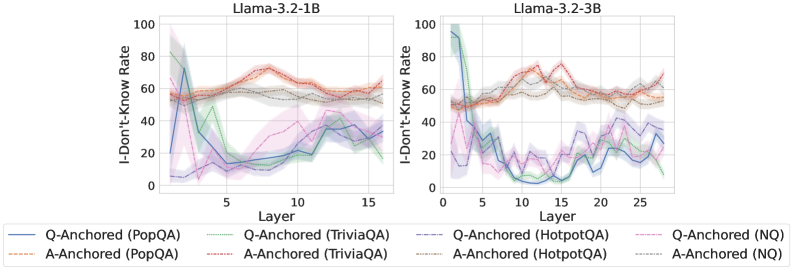
The image presents two line charts, side-by-side, displaying the "I-Don't-Know Rate" as a function of "Layer" for two different Llama models: Llama-3.2-1B and Llama-3.2-3B. Each chart shows multiple lines representing different question-answering datasets and anchoring methods. The charts are visually similar, with the right chart extending to a higher layer value.
### Components/Axes
* **X-axis:** "Layer" - ranging from approximately 0 to 15 for the left chart (Llama-3.2-1B) and from 0 to 25 for the right chart (Llama-3.2-3B). The axis is labeled with numerical markers at intervals of 5.
* **Y-axis:** "I-Don't-Know Rate" - ranging from 0 to 100. The axis is labeled with numerical markers at intervals of 20.
* **Title (Left Chart):** "Llama-3.2-1B" - positioned at the top-center.
* **Title (Right Chart):** "Llama-3.2-3B" - positioned at the top-center.
* **Legend:** Located at the bottom of the image, spanning both charts. It identifies the different lines by dataset and anchoring method.
* Q-Anchored (PopQA) - Blue solid line
* A-Anchored (PopQA) - Orange dashed line
* Q-Anchored (TriviaQA) - Green solid line
* A-Anchored (TriviaQA) - Red dashed line
* Q-Anchored (HotpotQA) - Gray dashed-dotted line
* A-Anchored (HotpotQA) - Gray solid line
* Q-Anchored (NQ) - Purple dashed-dotted line
* A-Anchored (NQ) - Purple solid line
### Detailed Analysis or Content Details
**Llama-3.2-1B (Left Chart):**
* **Q-Anchored (PopQA):** Starts at approximately 80, rapidly decreases to around 10-20 between layers 1 and 5, then fluctuates between 15 and 30 until layer 15.
* **A-Anchored (PopQA):** Starts at approximately 60, decreases to around 40-50 between layers 1 and 5, then remains relatively stable around 50-60 until layer 15.
* **Q-Anchored (TriviaQA):** Starts at approximately 60, decreases to around 10-20 between layers 1 and 5, then fluctuates between 20 and 40 until layer 15.
* **A-Anchored (TriviaQA):** Starts at approximately 60, decreases to around 40-50 between layers 1 and 5, then remains relatively stable around 50-60 until layer 15.
* **Q-Anchored (HotpotQA):** Starts at approximately 60, decreases to around 20-30 between layers 1 and 5, then fluctuates between 20 and 40 until layer 15.
* **A-Anchored (HotpotQA):** Starts at approximately 60, decreases to around 40-50 between layers 1 and 5, then remains relatively stable around 50-60 until layer 15.
* **Q-Anchored (NQ):** Starts at approximately 60, decreases to around 20-30 between layers 1 and 5, then fluctuates between 30 and 50 until layer 15.
* **A-Anchored (NQ):** Starts at approximately 60, decreases to around 40-50 between layers 1 and 5, then remains relatively stable around 50-60 until layer 15.
**Llama-3.2-3B (Right Chart):**
* **Q-Anchored (PopQA):** Starts at approximately 80, rapidly decreases to around 10-20 between layers 1 and 5, then fluctuates between 15 and 30 until layer 25.
* **A-Anchored (PopQA):** Starts at approximately 60, decreases to around 40-50 between layers 1 and 5, then remains relatively stable around 50-60 until layer 25.
* **Q-Anchored (TriviaQA):** Starts at approximately 60, decreases to around 10-20 between layers 1 and 5, then fluctuates between 20 and 40 until layer 25.
* **A-Anchored (TriviaQA):** Starts at approximately 60, decreases to around 40-50 between layers 1 and 5, then remains relatively stable around 50-60 until layer 25.
* **Q-Anchored (HotpotQA):** Starts at approximately 60, decreases to around 20-30 between layers 1 and 5, then fluctuates between 20 and 40 until layer 25.
* **A-Anchored (HotpotQA):** Starts at approximately 60, decreases to around 40-50 between layers 1 and 5, then remains relatively stable around 50-60 until layer 25.
* **Q-Anchored (NQ):** Starts at approximately 60, decreases to around 20-30 between layers 1 and 5, then fluctuates between 30 and 50 until layer 25.
* **A-Anchored (NQ):** Starts at approximately 60, decreases to around 40-50 between layers 1 and 5, then remains relatively stable around 50-60 until layer 25.
### Key Observations
* All lines exhibit a significant decrease in "I-Don't-Know Rate" within the first 5 layers.
* The "Q-Anchored" lines generally have lower "I-Don't-Know Rates" than the "A-Anchored" lines, especially after the initial decrease.
* The "I-Don't-Know Rate" stabilizes after layer 5 for most lines, with some fluctuations.
* The trends are remarkably similar between the two models (Llama-3.2-1B and Llama-3.2-3B), although the right chart extends to a higher layer value.
### Interpretation
The charts demonstrate how the "I-Don't-Know Rate" changes with the depth (layer) of the Llama models. The initial rapid decrease suggests that the models quickly learn to answer questions within the first few layers. The subsequent stabilization indicates that further layers provide diminishing returns in terms of reducing the "I-Don't-Know Rate."
The difference between "Q-Anchored" and "A-Anchored" methods suggests that question-anchoring is more effective than answer-anchoring in reducing uncertainty. This could be because question-anchoring provides more direct guidance to the model during training.
The similarity between the two models (1B and 3B) suggests that the underlying learning dynamics are consistent, even with different model sizes. The extended layer range in the 3B model doesn't drastically alter the overall trend, implying that increasing model size alone may not be sufficient to significantly reduce the "I-Don't-Know Rate" beyond a certain point. The data suggests that the models are learning to avoid answering questions they are unsure about, and this behavior is influenced by the anchoring method used during training.