## Line Graph: I-Don't-Know Rate Across Layers in LLaMA-3.2 Models
### Overview
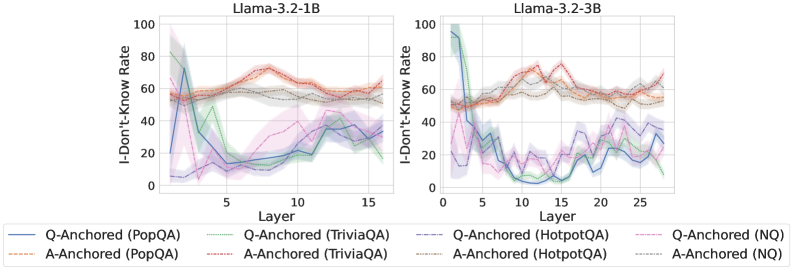
The image contains two line graphs comparing the "I-Don't-Know Rate" (IDK rate) across layers in two LLaMA-3.2 models: **LLaMA-3.2-1B** (left) and **LLaMA-3.2-3B** (right). Each graph shows six data series (lines) representing different anchoring methods (Q-Anchored/A-Anchored) and datasets (PopQA, TriviaQA, HotpotQA, NQ). The y-axis measures IDK rate (%), and the x-axis represents model layers.
---
### Components/Axes
- **X-Axis (Layer)**:
- LLaMA-3.2-1B: 0–15 layers (discrete increments).
- LLaMA-3.2-3B: 0–25 layers (discrete increments).
- **Y-Axis (I-Don't-Know Rate)**: 0–100% (continuous scale).
- **Legends**:
- **LLaMA-3.2-1B**:
- Solid blue: Q-Anchored (PopQA)
- Dashed green: Q-Anchored (TriviaQA)
- Dotted red: A-Anchored (PopQA)
- Dashed gray: A-Anchored (TriviaQA)
- Solid purple: Q-Anchored (HotpotQA)
- Dotted black: A-Anchored (HotpotQA)
- **LLaMA-3.2-3B**:
- Solid blue: Q-Anchored (PopQA)
- Dashed green: Q-Anchored (TriviaQA)
- Dotted red: A-Anchored (PopQA)
- Dashed gray: A-Anchored (TriviaQA)
- Solid purple: Q-Anchored (HotpotQA)
- Dotted black: A-Anchored (NQ)
---
### Detailed Analysis
#### LLaMA-3.2-1B (Left Graph)
1. **Q-Anchored (PopQA)** (solid blue):
- Starts at ~80% at layer 0, drops sharply to ~20% by layer 5, then fluctuates between ~30–50%.
2. **Q-Anchored (TriviaQA)** (dashed green):
- Begins at ~60%, dips to ~10% at layer 5, then rises to ~40% by layer 15.
3. **A-Anchored (PopQA)** (dotted red):
- Starts at ~50%, peaks at ~70% at layer 5, then declines to ~40%.
4. **A-Anchored (TriviaQA)** (dashed gray):
- Starts at ~40%, drops to ~20% at layer 5, then stabilizes near ~30%.
5. **Q-Anchored (HotpotQA)** (solid purple):
- Begins at ~70%, plunges to ~10% at layer 5, then oscillates between ~20–40%.
6. **A-Anchored (HotpotQA)** (dotted black):
- Starts at ~60%, drops to ~30% at layer 5, then stabilizes near ~40%.
#### LLaMA-3.2-3B (Right Graph)
1. **Q-Anchored (PopQA)** (solid blue):
- Starts at ~90%, drops to ~30% at layer 5, then fluctuates between ~40–60%.
2. **Q-Anchored (TriviaQA)** (dashed green):
- Begins at ~70%, dips to ~10% at layer 5, then rises to ~50% by layer 25.
3. **A-Anchored (PopQA)** (dotted red):
- Starts at ~60%, peaks at ~80% at layer 5, then declines to ~50%.
4. **A-Anchored (TriviaQA)** (dashed gray):
- Starts at ~50%, drops to ~20% at layer 5, then stabilizes near ~35%.
5. **Q-Anchored (HotpotQA)** (solid purple):
- Begins at ~80%, plunges to ~10% at layer 5, then oscillates between ~20–50%.
6. **A-Anchored (NQ)** (dotted black):
- Starts at ~70%, drops to ~40% at layer 5, then stabilizes near ~50%.
---
### Key Observations
1. **General Trend**: IDK rates generally decrease as layers increase, but with significant fluctuations.
2. **Dataset Variability**:
- **HotpotQA** consistently shows the highest initial IDK rates (~70–90%) and sharpest declines.
- **NQ** (only in 3.2-3B) exhibits moderate IDK rates (~40–70%) with gradual declines.
3. **Anchoring Method Differences**:
- **Q-Anchored** methods (PopQA, TriviaQA, HotpotQA) show steeper initial drops compared to **A-Anchored** methods.
- **A-Anchored (PopQA)** in 3.2-3B peaks at ~80% at layer 5, the highest IDK rate observed.
4. **Outliers**:
- Q-Anchored (HotpotQA) in 3.2-3B has a sharp spike to ~50% at layer 20, deviating from its earlier trend.
---
### Interpretation
1. **Model Behavior**:
- The IDK rate reflects the model's uncertainty in answering questions. Lower rates suggest higher confidence.
- **Q-Anchored** methods (question-focused) show more pronounced declines, possibly due to better alignment with question semantics.
- **A-Anchored** methods (answer-focused) exhibit higher variability, suggesting sensitivity to answer-specific features.
2. **Dataset Complexity**:
- **HotpotQA** (multi-hop reasoning) likely drives higher initial uncertainty, as deeper layers may struggle with complex reasoning.
- **NQ** (factual QA) shows more stable IDK rates, indicating consistent performance across layers.
3. **Layer-Specific Insights**:
- Layer 5 consistently acts as a critical point where IDK rates drop sharply, possibly marking a transition from surface-level to deeper contextual processing.
- In 3.2-3B, the larger model size (25 layers) allows for more nuanced IDK rate modulation, especially in later layers (e.g., layer 20+).
---
### Conclusion
The graphs reveal that anchoring methods and dataset complexity significantly influence IDK rates. Q-Anchored methods generally reduce uncertainty more effectively, while larger models (3.2-3B) exhibit finer-grained layer-specific behavior. These trends highlight the importance of anchoring strategies in balancing model confidence and performance.