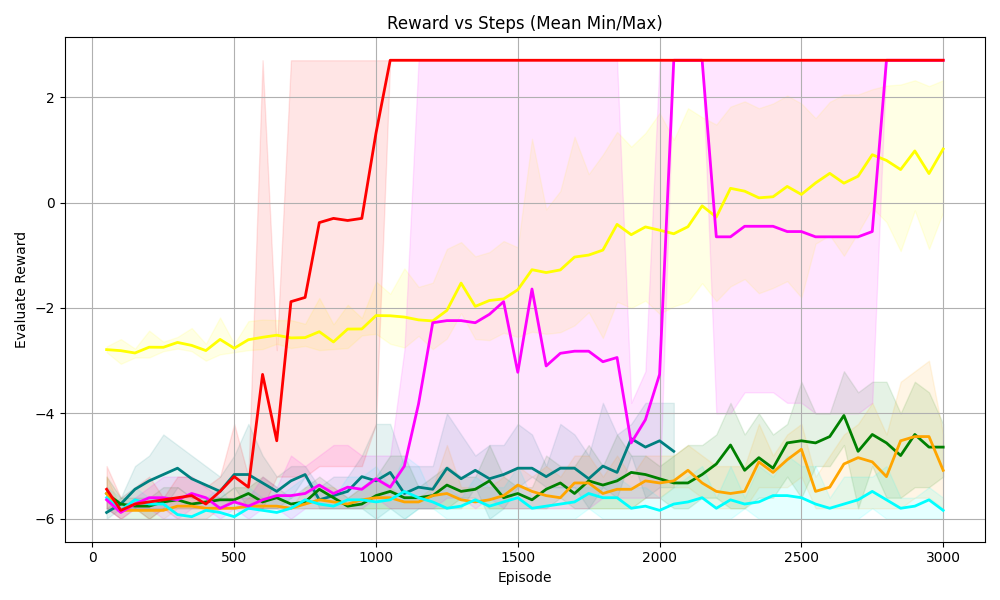
## [Line Chart with Shaded Regions]: Reward vs Steps (Mean Min/Max)
### Overview
The image is a line chart titled *“Reward vs Steps (Mean Min/Max)”* that plots **Evaluate Reward** (y-axis) against **Episode** (x-axis) for multiple data series. Each line represents a distinct series (e.g., algorithm or agent), with shaded regions (likely min/max ranges or confidence intervals) surrounding the lines to show variability.
### Components/Axes
- **Title**: *“Reward vs Steps (Mean Min/Max)”* (top-center).
- **X-axis**: Label *“Episode”* (bottom-center), with ticks at 0, 500, 1000, 1500, 2000, 2500, 3000.
- **Y-axis**: Label *“Evaluate Reward”* (left-center), with ticks at -6, -4, -2, 0, 2.
- **Legend**: Implicit (no explicit labels), but multiple colored lines (red, yellow, magenta, green, orange, cyan, teal) with corresponding shaded regions (pink, yellow, green, etc.) behind them.
### Detailed Analysis (Line-by-Line Trends & Values)
We analyze each line by color, trend, and approximate values (with uncertainty):
1. **Red Line**
- **Trend**: Starts at ~-6 (episode 0), rises sharply between episodes 500–1000, reaches ~2 by episode 1000, then *plateaus* (flat line) from 1000–3000.
- **Shaded Region**: Pinkish, wide during the rise (high variability) and narrow during the plateau (low variability).
2. **Yellow Line**
- **Trend**: Starts at ~-3 (episode 0), fluctuates slightly, then *gradually rises* from ~1500–3000, reaching ~1 by episode 3000.
- **Shaded Region**: Yellowish, follows the line’s trend (wider during growth).
3. **Magenta Line**
- **Trend**: Starts at ~-6 (episode 0), rises to ~-2 by episode 1000, fluctuates, drops to ~-4 around episode 2000, then *rises again* to ~-1 by episode 3000.
- **Shaded Region**: Pinkish, follows the line’s fluctuations (wider during drops/rises).
4. **Green Line**
- **Trend**: Starts at ~-6 (episode 0), fluctuates, then *gradually rises* from ~2000–3000, reaching ~-4 by episode 3000.
- **Shaded Region**: Greenish, follows the line (wider during growth).
5. **Orange Line**
- **Trend**: Starts at ~-6 (episode 0), fluctuates, then *gradually rises* from ~2000–3000, reaching ~-4 by episode 3000.
- **Shaded Region**: Orangeish, follows the line (wider during growth).
6. **Cyan Line**
- **Trend**: Starts at ~-6 (episode 0), fluctuates slightly, remains *relatively flat* (around -6) throughout.
- **Shaded Region**: Cyanish, narrow (low variability).
7. **Teal Line**
- **Trend**: Starts at ~-6 (episode 0), fluctuates, then *rises slightly* from ~2000–3000, reaching ~-5 by episode 3000.
- **Shaded Region**: Tealish, follows the line (wider during growth).
### Key Observations
- The **red line** has the most dramatic improvement: it rapidly reaches the highest reward (2) and stabilizes.
- The **yellow line** shows steady, gradual growth (especially after episode 1500).
- The **magenta line** exhibits significant fluctuations (e.g., a drop around episode 2000) before recovering.
- Most lines (cyan, teal, green, orange) start at low rewards (-6) and show minimal improvement, with cyan remaining nearly flat.
- Shaded regions (min/max) are wider during periods of change (e.g., red line’s rise) and narrower during plateaus (e.g., red line after 1000).
### Interpretation
This chart likely compares the performance of **reinforcement learning agents/algorithms** over training episodes, where *“Evaluate Reward”* measures task success.
- The red line’s rapid rise and plateau suggest a highly effective algorithm that quickly learns and stabilizes.
- The yellow line’s steady increase indicates a slower but consistent learning process.
- The magenta line’s fluctuations may reflect instability (e.g., exploration-exploitation trade-offs) or sensitivity to training dynamics.
- The flat cyan line and slow-growing green/orange/teal lines suggest less effective algorithms or slower learning.
Shaded regions (min/max) highlight variability: wider regions during learning phases (more uncertainty) and narrower regions during stable phases (less uncertainty). This data helps identify top-performing algorithms, assess learning curves, and evaluate stability—critical for optimizing reinforcement learning systems.
(Note: No non-English text is present; all labels are in English.)