## Line Chart: Reward vs Steps (Mean Min/Max)
### Overview
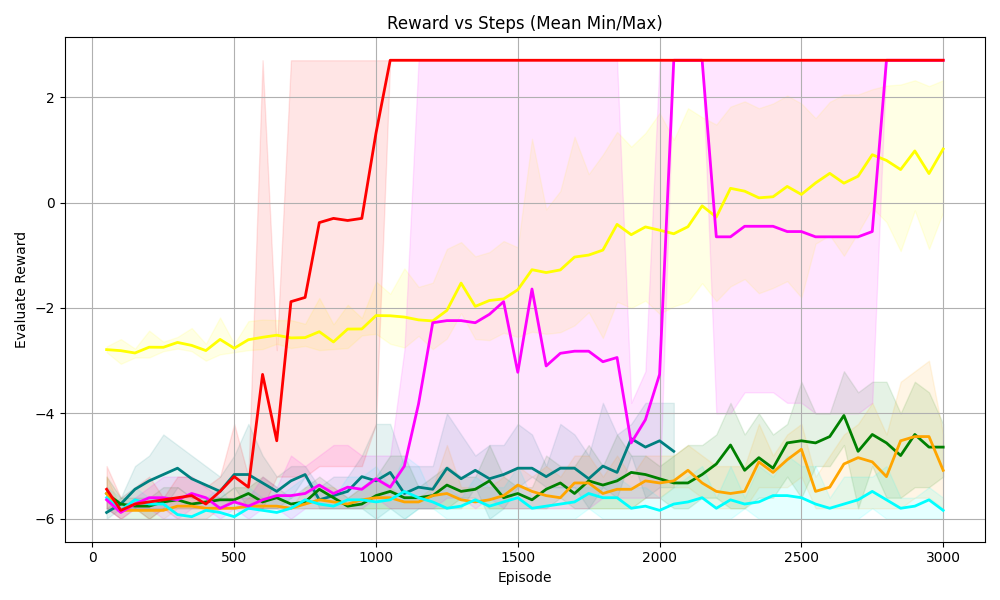
The chart visualizes the relationship between "Episode" (x-axis) and "Evaluated Reward" (y-axis) for six distinct data series, represented by colored lines with shaded confidence intervals. The y-axis ranges from -6 to 2, while the x-axis spans 0 to 3000 episodes. Each line corresponds to a labeled agent (A-F), with variability shaded in adjacent colors.
### Components/Axes
- **X-axis (Episode)**: Labeled "Episode," with ticks at 0, 500, 1000, 1500, 2000, 2500, and 3000.
- **Y-axis (Evaluated Reward)**: Labeled "Evaluated Reward," with ticks at -6, -4, -2, 0, and 2.
- **Legend**: Positioned on the right, mapping colors to agents:
- Red: Agent A
- Yellow: Agent B
- Purple: Agent C
- Green: Agent D
- Blue: Agent E
- Cyan: Agent F
- **Shaded Areas**: Each line has a shaded region (e.g., red for Agent A) representing variability (likely min/max bounds).
### Detailed Analysis
1. **Agent A (Red)**:
- Starts near -6 at Episode 0.
- Sharp upward spike to ~2 at Episode 500, then plateaus.
- Shaded area narrows significantly after Episode 500, indicating reduced variability.
2. **Agent B (Yellow)**:
- Begins at ~-3.5, gradually increases to ~1 by Episode 3000.
- Shaded area widens initially, then stabilizes after Episode 1500.
3. **Agent C (Purple)**:
- Starts near -5, remains flat until Episode 2000.
- Sharp rise to ~-1 at Episode 2000, then stabilizes.
- Shaded area expands post-2000, suggesting increased variability.
4. **Agent D (Green)**:
- Starts at ~-5.5, fluctuates minimally until Episode 2500.
- Gradual increase to ~-3 by Episode 3000.
- Shaded area remains narrow throughout.
5. **Agent E (Blue)**:
- Consistently the lowest line, hovering near -6.
- Minimal movement, with a narrow shaded area.
6. **Agent F (Cyan)**:
- Most erratic line, oscillating between -6 and -4.
- Shaded area is the widest, indicating high variability.
### Key Observations
- **Agent A** achieves the highest reward (~2) but only after a dramatic early spike.
- **Agent C** shows a late-stage improvement (~2000 episodes) but remains below Agent A.
- **Agent E** performs the worst, maintaining near-minimum rewards.
- **Agent F** exhibits the highest variability, with rewards fluctuating widely.
- All agents start with negative rewards, but only Agent A reaches positive values.
### Interpretation
The data suggests that **Agent A** is the most effective, achieving optimal rewards early and maintaining stability. **Agent C** demonstrates a delayed but significant improvement, while **Agent E** remains consistently underperforming. The shaded areas highlight that variability in performance is agent-dependent: Agent F’s wide confidence intervals suggest instability, whereas Agent D’s narrow bounds indicate reliability. The sharp spikes (e.g., Agent A at 500 episodes, Agent C at 2000) may reflect algorithmic milestones or environmental changes. Overall, the chart emphasizes trade-offs between early performance gains, long-term stability, and variability across agents.