## Diagram: Image Processing Pipeline
### Overview
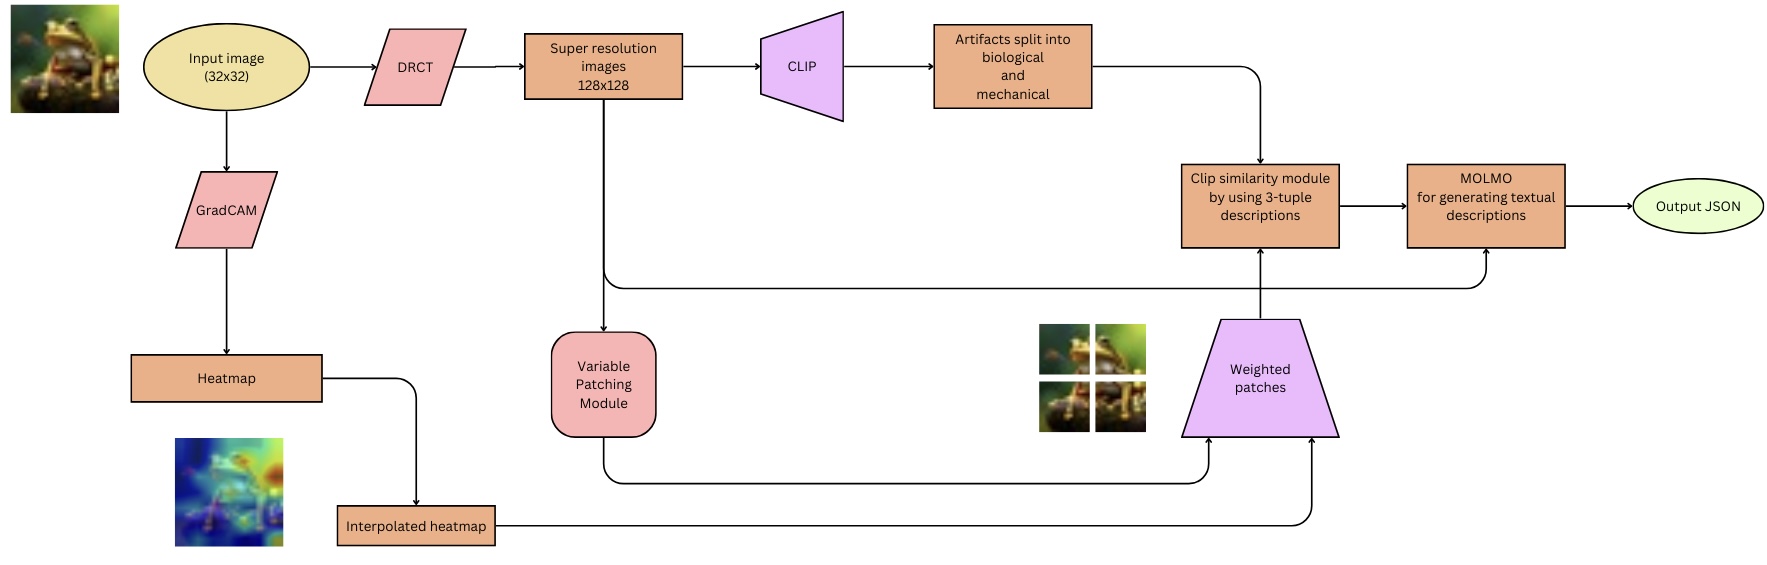
The image is a flowchart illustrating an image processing pipeline. It starts with an input image, processes it through several modules, and outputs a JSON file. The pipeline includes steps for super-resolution, artifact splitting, similarity analysis, and textual description generation.
### Components/Axes
The diagram consists of several modules represented by different shapes:
* **Oval:** Represents input and output.
* **Rectangle:** Represents processing modules.
* **Parallelogram:** Represents a specific type of module (CLIP).
* **Rhombus:** Represents a specific type of module (DRCT, GradCAM).
* **Rounded Rectangle:** Represents a specific type of module (Variable Patching Module).
The flow of data is indicated by arrows connecting the modules.
### Detailed Analysis or ### Content Details
1. **Input Image:**
* Shape: Oval
* Label: "Input image (32x32)"
* Position: Top-left
* Content: A small image of a frog.
2. **DRCT:**
* Shape: Rhombus
* Label: "DRCT"
* Position: Right of "Input image"
3. **Super resolution images:**
* Shape: Rectangle
* Label: "Super resolution images 128x128"
* Position: Right of "DRCT"
4. **CLIP:**
* Shape: Parallelogram
* Label: "CLIP"
* Position: Right of "Super resolution images"
5. **Artifacts split into biological and mechanical:**
* Shape: Rectangle
* Label: "Artifacts split into biological and mechanical"
* Position: Right of "CLIP"
6. **Clip similarity module by using 3-tuple descriptions:**
* Shape: Rectangle
* Label: "Clip similarity module by using 3-tuple descriptions"
* Position: Right and slightly below "Artifacts split into biological and mechanical"
7. **MOLMO for generating textual descriptions:**
* Shape: Rectangle
* Label: "MOLMO for generating textual descriptions"
* Position: Right of "Clip similarity module"
8. **Output JSON:**
* Shape: Oval
* Label: "Output JSON"
* Position: Right of "MOLMO"
9. **GradCAM:**
* Shape: Rhombus
* Label: "GradCAM"
* Position: Below "Input image"
10. **Heatmap:**
* Shape: Rectangle
* Label: "Heatmap"
* Position: Below "GradCAM"
11. **Interpolated heatmap:**
* Shape: Rectangle
* Label: "Interpolated heatmap"
* Position: Below "Heatmap"
* Content: A heatmap image highlighting regions of interest.
12. **Variable Patching Module:**
* Shape: Rounded Rectangle
* Label: "Variable Patching Module"
* Position: Below "Super resolution images"
13. **Weighted patches:**
* Shape: Parallelogram
* Label: "Weighted patches"
* Position: Below and left of "Clip similarity module"
* Content: An image divided into four patches.
### Key Observations
* The pipeline starts with a low-resolution image (32x32) and generates a high-resolution image (128x128).
* The GradCAM module generates a heatmap, which is then interpolated.
* The Variable Patching Module and Weighted Patches are used in conjunction with the CLIP similarity module.
* The final output is a JSON file containing textual descriptions generated by the MOLMO module.
### Interpretation
The diagram illustrates a complex image processing pipeline designed to generate textual descriptions of images. The pipeline uses a combination of techniques, including super-resolution, attention mechanisms (GradCAM), and similarity analysis (CLIP) to extract relevant information from the image. The MOLMO module then uses this information to generate textual descriptions. The use of variable patching and weighted patches suggests that the pipeline focuses on specific regions of interest within the image. The final output in JSON format indicates that the textual descriptions are structured and can be easily processed by other applications.