## Diagram: LBM Network Architecture
### Overview
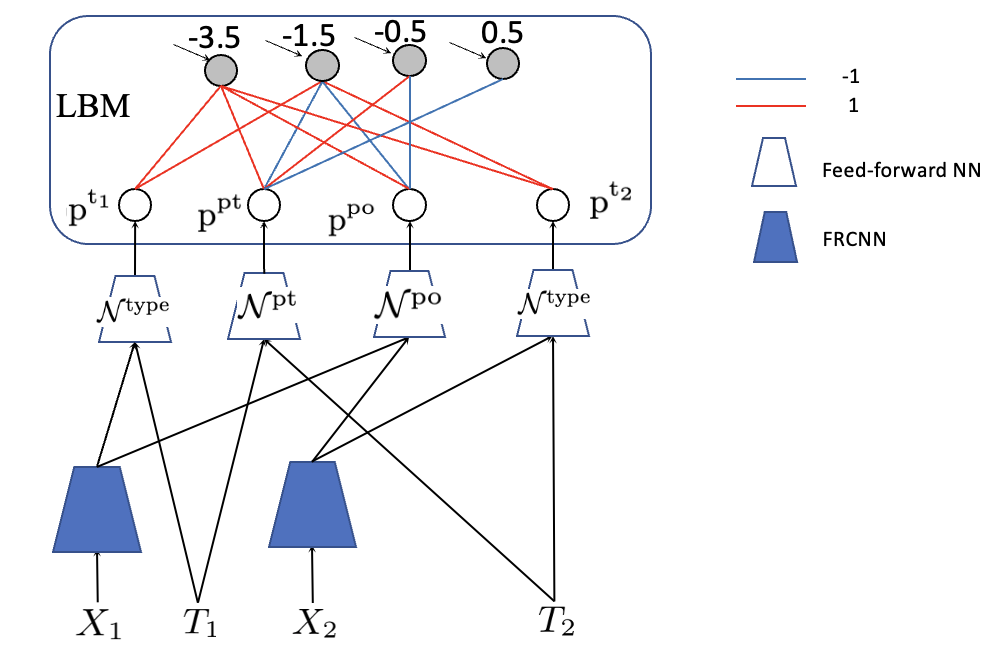
This diagram illustrates the architecture of a network involving a Latent Box Model (LBM) and Faster R-CNN (FRCNN) components. The diagram depicts the flow of information between these components, with connections weighted by numerical values. The LBM appears to process information from multiple FRCNN outputs across different time steps.
### Components/Axes
* **LBM:** A rectangular box labeled "LBM" in the top-center of the diagram.
* **FRCNN:** Represented by trapezoidal shapes labeled X₁, T₁, X₂, and T₂ at the bottom of the diagram.
* **Nodes:** Circular nodes labeled p<sup>t1</sup>, p<sup>pt</sup>, p<sup>po</sup>, and p<sup>t2</sup> within the LBM.
* **Connections:** Lines connecting FRCNN outputs to LBM nodes, with varying colors (blue and red) and weights.
* **Labels:** N<sup>type</sup>, N<sup>pt</sup>, N<sup>po</sup> labels indicating connections between FRCNN outputs and LBM nodes.
* **Weights:** Numerical values above the LBM nodes: -3.5, -1.5, -0.5, 0.5.
* **Legend:** Located in the top-right corner, defining line colors as representing weights of -1 (blue) and 1 (red). Also defines the shapes for Feed-forward NN and FRCNN.
### Detailed Analysis or Content Details
The diagram shows the following connections and weights:
* **X₁ to p<sup>t1</sup>:** Connection with an unspecified weight (implied to be positive, as it's a red line).
* **T₁ to p<sup>pt</sup>:** Connection with an unspecified weight (implied to be positive, as it's a red line).
* **X₂ to p<sup>po</sup>:** Connection with an unspecified weight (implied to be positive, as it's a red line).
* **T₂ to p<sup>t2</sup>:** Connection with an unspecified weight (implied to be positive, as it's a red line).
* **p<sup>t1</sup> to -3.5:** A red line connecting p<sup>t1</sup> to the weight -3.5.
* **p<sup>pt</sup> to -1.5:** A red line connecting p<sup>pt</sup> to the weight -1.5.
* **p<sup>po</sup> to -0.5:** A red line connecting p<sup>po</sup> to the weight -0.5.
* **p<sup>t2</sup> to 0.5:** A red line connecting p<sup>t2</sup> to the weight 0.5.
* **p<sup>t1</sup> to p<sup>pt</sup>:** A blue line connecting p<sup>t1</sup> to p<sup>pt</sup>.
* **p<sup>pt</sup> to p<sup>po</sup>:** A blue line connecting p<sup>pt</sup> to p<sup>po</sup>.
* **p<sup>po</sup> to p<sup>t2</sup>:** A blue line connecting p<sup>po</sup> to p<sup>t2</sup>.
* **p<sup>t1</sup> to p<sup>po</sup>:** A blue line connecting p<sup>t1</sup> to p<sup>po</sup>.
* **p<sup>pt</sup> to p<sup>t2</sup>:** A blue line connecting p<sup>pt</sup> to p<sup>t2</sup>.
* **X₁ to p<sup>pt</sup>:** A blue line connecting X₁ to p<sup>pt</sup>.
* **X₁ to p<sup>po</sup>:** A blue line connecting X₁ to p<sup>po</sup>.
* **T₁ to p<sup>po</sup>:** A blue line connecting T₁ to p<sup>po</sup>.
* **X₂ to p<sup>pt</sup>:** A blue line connecting X₂ to p<sup>pt</sup>.
* **X₂ to p<sup>t2</sup>:** A blue line connecting X₂ to p<sup>t2</sup>.
* **T₂ to p<sup>t1</sup>:** A blue line connecting T₂ to p<sup>t1</sup>.
* **T₂ to p<sup>t2</sup>:** A blue line connecting T₂ to p<sup>t2</sup>.
### Key Observations
* The LBM nodes (p<sup>t1</sup>, p<sup>pt</sup>, p<sup>po</sup>, p<sup>t2</sup>) appear to integrate information from multiple FRCNN outputs (X₁, T₁, X₂, T₂).
* The connections between LBM nodes are predominantly negative (blue lines), suggesting inhibitory relationships.
* The connections from FRCNN outputs to LBM nodes are predominantly positive (red lines), suggesting excitatory relationships.
* The weights associated with the LBM nodes are negative, indicating a potential suppression or reduction of activity.
* The diagram suggests a temporal aspect, with 't1' and 't2' potentially representing different time steps.
### Interpretation
This diagram likely represents a model for object tracking or scene understanding. The FRCNN components (X₁, T₁, X₂, T₂) likely represent object detections and their associated features at different time steps. The LBM acts as a latent variable model, integrating these detections to infer the underlying state of the scene. The negative weights on the LBM nodes suggest that the model is designed to filter out noise or inconsistencies in the detections. The connections between the LBM nodes represent dependencies between the latent variables. The overall architecture suggests a system that can maintain a consistent representation of the scene over time, even in the presence of noisy or incomplete observations. The use of both positive and negative connections indicates a complex interplay between different features and latent variables. The weights -3.5, -1.5, -0.5, and 0.5 suggest a graded influence of the LBM nodes, with -3.5 having the strongest suppressive effect and 0.5 having the weakest. The diagram does not provide any information about the specific functions of the FRCNN components or the LBM nodes, but it does provide a clear overview of the overall architecture and the flow of information.