# Technical Document Extraction: Accuracy vs. Context Length
## 1. Labels and Axis Titles
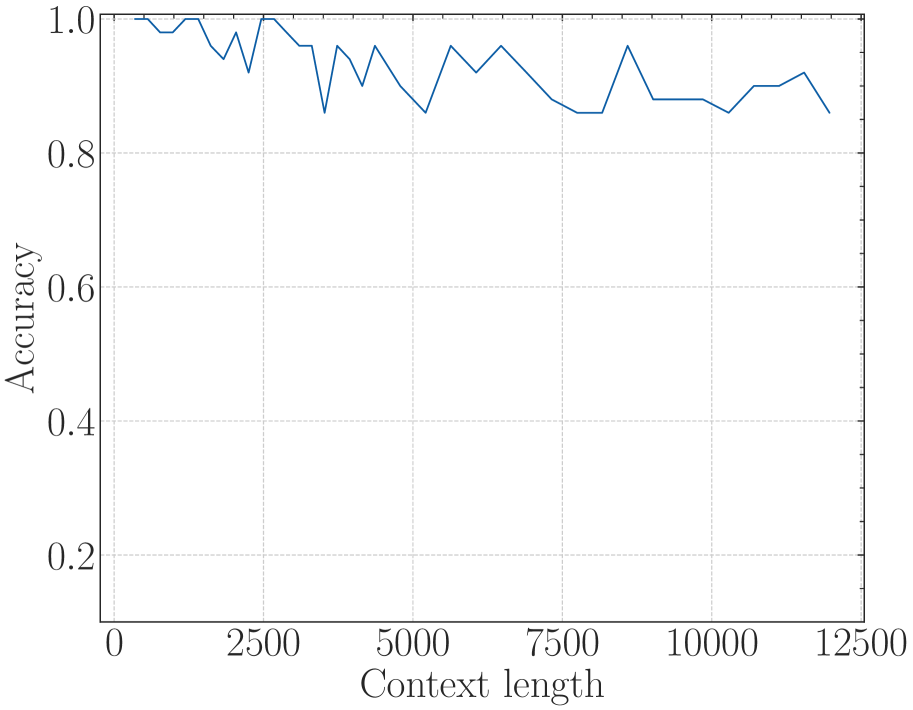
- **Y-Axis**: Labeled "Accuracy" with tick marks at 0.2, 0.4, 0.6, 0.8, and 1.0.
- **X-Axis**: Labeled "Context length" with tick marks at 0, 2500, 5000, 7500, 10000, and 12500.
- **Grid**: Light gray dotted grid lines span the entire plot area.
## 2. Line Graph Components
- **Line Color**: Blue (no legend present; assumed to represent "Accuracy" metric).
- **Line Behavior**:
- Starts at (0, 1.0) with a sharp initial decline.
- Fluctuates between ~0.85 and ~0.95 for context lengths ≤5000.
- Gradual decline to ~0.88 at 10,000 context length.
- Slight upward trend to ~0.92 at 12,500 context length.
## 3. Key Trends and Data Points
### Initial Decline (0–2500)
- **Trend**: Sharp drop from 1.0 to ~0.95, followed by stabilization.
- **Data Points**:
- (0, 1.0)
- (2500, ~0.95)
### Mid-Range Fluctuations (2500–7500)
- **Trend**: Oscillates between ~0.85 and ~0.95 with no clear directional bias.
- **Data Points**:
- (5000, ~0.95)
- (7500, ~0.88)
### Late-Stage Decline and Recovery (7500–12500)
- **Trend**: Gradual decline to ~0.88 at 10,000, followed by a minor recovery to ~0.92 at 12,500.
- **Data Points**:
- (10000, ~0.88)
- (12500, ~0.92)
## 4. Observations
- **Stability**: Accuracy stabilizes near 0.9 after initial fluctuations.
- **Context Length Impact**: No significant improvement beyond 5000 context length; minor degradation observed at higher lengths.
- **No Legend**: No explicit legend present to clarify line semantics.
## 5. Missing Elements
- **Data Table**: Not present in the image.
- **Embedded Text**: No additional annotations or labels beyond axis titles and tick marks.
## 6. Spatial Grounding
- **Legend**: Not applicable (no legend present).
- **Line Placement**: Blue line occupies the central region of the plot, adhering to the grid structure.
## 7. Trend Verification
- **Initial Drop**: Confirmed by steep decline from (0, 1.0) to (2500, ~0.95).
- **Mid-Range Oscillations**: Validated by alternating peaks and troughs between 2500–7500.
- **Late-Stage Behavior**: Decline to 10,000 and recovery to 12,500 aligns with visual trend.
## 8. Component Isolation
- **Main Chart**: Line graph dominates the image, with axes and grid providing context.
- **No Header/Footer**: No additional textual or graphical elements outside the plot area.
## 9. Language and Transcription
- **Primary Language**: English (all labels and titles are in English).
- **Transcribed Text**:
- Y-Axis: "Accuracy"
- X-Axis: "Context length"
- Tick Marks: Numerical values as listed above.
## 10. Conclusion
The graph illustrates a non-monotonic relationship between context length and accuracy. While accuracy begins at 1.0, it stabilizes near 0.9 after initial fluctuations, with no clear correlation to increasing context length beyond 5000.