## Chart/Diagram Type: Multi-Panel Image
### Overview
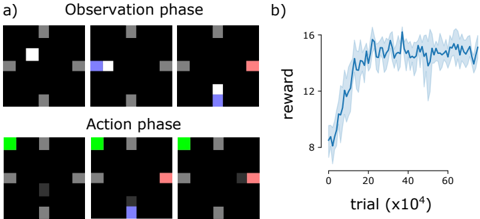
The image consists of two panels, labeled a) and b). Panel a) shows a series of six images depicting an "Observation phase" and an "Action phase." These images appear to represent a visual task or game environment. Panel b) presents a line graph showing the "reward" over "trial (x10^4)".
### Components/Axes
**Panel a):**
* **Title:** Observation phase, Action phase
* **Content:** Six images arranged in two rows of three. Each image shows a black background with gray rectangular obstacles and a colored square (white, blue, green, red). The colored square changes position and color between the observation and action phases.
**Panel b):**
* **X-axis:** trial (x10^4). The axis ranges from 0 to 60. Axis markers are present at 0, 20, 40, and 60.
* **Y-axis:** reward. The axis ranges from approximately 8 to 16. Axis markers are present at 8, 12, and 16.
* **Data:** A blue line graph with a shaded blue area around the line, representing the standard deviation or confidence interval.
### Detailed Analysis or Content Details
**Panel a):**
* The images in the "Observation phase" show a white, blue, and red square respectively.
* The images in the "Action phase" show a green, black, and red square respectively.
**Panel b):**
* The blue line starts at approximately 8 reward units at trial 0.
* The line increases sharply until approximately trial 20 (x10^4), reaching a reward of approximately 14.
* From trial 20 (x10^4) to trial 60 (x10^4), the line fluctuates around a reward value of approximately 15, with some peaks and dips. The shaded area around the line also varies in width, indicating changes in the variability of the reward.
### Key Observations
* Panel a) shows a visual task with changing colored squares.
* Panel b) shows a learning curve, where the reward increases rapidly initially and then plateaus with fluctuations.
### Interpretation
The image likely represents a reinforcement learning experiment. Panel a) illustrates the environment in which an agent interacts, with observation and action phases. The agent observes the environment (colored squares) and then takes an action. Panel b) shows the learning progress of the agent, with the reward increasing as the agent learns to perform the task effectively. The initial rapid increase in reward suggests a quick learning phase, followed by a plateau indicating that the agent has reached a stable level of performance. The fluctuations in the reward and the shaded area indicate the variability in the agent's performance.