## [Chart/Diagram Type]: Reinforcement Learning Training Visualization
### Overview
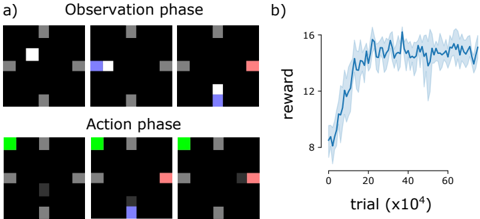
The image is a composite figure containing two main parts, labeled **a)** and **b)**. Part **a)** is a diagrammatic representation of an agent's interaction with a grid-world environment, split into two sequential phases. Part **b)** is a line chart showing the learning curve (reward over trials) of an agent, presumably the one depicted in part a).
### Components/Axes
#### Part a) - Environment Interaction Diagram
* **Structure:** Two rows of three panels each.
* **Row Labels (Top to Bottom):**
* Top Row: `Observation phase`
* Bottom Row: `Action phase`
* **Panel Content:** Each panel shows a 5x5 grid (approximate) with a black background. The grid contains static gray blocks and dynamic colored squares.
* **Color Key (Inferred from visual context):**
* **Gray:** Static obstacles or walls.
* **White:** The agent's starting position (only visible in the first panel of the Observation phase).
* **Blue:** The agent's position after movement.
* **Green:** A target or goal location (only visible in the Action phase).
* **Red:** A secondary target or item (appears in later panels).
#### Part b) - Reward Chart
* **Chart Type:** Line chart with a shaded error region.
* **Y-Axis:**
* **Label:** `reward`
* **Scale:** Linear, ranging from 8 to 16. Major tick marks at 8, 12, 16.
* **X-Axis:**
* **Label:** `trial (x10^4)`
* **Scale:** Linear, ranging from 0 to approximately 70 (representing 0 to 700,000 trials). Major tick marks at 0, 20, 40, 60.
* **Data Series:**
* **Solid Blue Line:** Represents the mean reward across trials.
* **Light Blue Shaded Area:** Represents the variance or standard deviation around the mean reward.
### Detailed Analysis
#### Part a) - Phase Breakdown
1. **Observation phase (Top Row):**
* **Panel 1 (Left):** A white square (agent) is positioned in the upper-left quadrant of the grid. Several gray blocks are scattered.
* **Panel 2 (Center):** The agent (now blue) has moved one step to the right. A faint blue trail indicates its previous position.
* **Panel 3 (Right):** The agent (blue) has moved down one step. A red square appears in the upper-right quadrant.
2. **Action phase (Bottom Row):**
* **Panel 1 (Left):** A green square (goal) appears in the top-left corner. The agent (blue) is not visible, likely reset to start.
* **Panel 2 (Center):** The agent (blue) is now at the bottom-center of the grid. The red square is visible on the right edge.
* **Panel 3 (Right):** The agent (blue) has moved to the right, adjacent to the red square. The green goal remains in the top-left.
#### Part b) - Data Trend & Points
* **Trend Verification:** The blue line shows a steep, logarithmic-like increase in reward from the start, which gradually plateaus. The shaded variance is widest during the steep learning phase and narrows as performance stabilizes.
* **Key Data Points (Approximate):**
* **Trial 0 (x10^4):** Mean reward starts at ~8.
* **Trial ~10 (x10^4):** Reward crosses 12.
* **Trial ~20 (x10^4):** Reward approaches 14.
* **Trial ~40 (x10^4):** Reward begins to plateau around 15.
* **Trial 60-70 (x10^4):** Reward stabilizes between 15 and 16, with minor fluctuations.
### Key Observations
1. **Learning Curve:** The agent demonstrates rapid initial learning, with most gains occurring within the first 200,000 trials (20 x10^4). Performance plateaus after approximately 400,000 trials.
2. **Variance Reduction:** The narrowing of the shaded area indicates the agent's performance becomes more consistent and reliable as training progresses.
3. **Environment Complexity:** The diagram in part a) suggests a partially observable or sequential decision-making task where the agent must navigate, avoid obstacles (gray), and possibly interact with or reach specific targets (green goal, red item).
### Interpretation
This figure collectively illustrates the training process and outcome of a reinforcement learning agent in a grid-world navigation task.
* **What the data suggests:** The chart in **b)** provides quantitative evidence of successful learning. The agent's ability to accumulate reward improves dramatically with experience and then stabilizes, indicating it has likely converged on a near-optimal policy for the given environment.
* **How elements relate:** Part **a)** provides the *qualitative context* for the quantitative results in **b)**. It shows the *type* of problem the agent is solving (spatial navigation with goals and obstacles), which explains the learning curve's shape. The initial low reward corresponds to random exploration, while the high, stable reward corresponds to efficient goal-directed behavior.
* **Notable patterns/anomalies:** The learning curve is smooth and textbook-like, showing no major collapses or instability, which suggests a well-tuned training setup. The presence of two distinct colored targets (green and red) in the action phase diagram hints at a potentially multi-objective or sparse-reward task, making the achieved high reward more significant. The agent's path in the action phase (moving to the red square) might indicate it learned to prioritize that target over the green one in that specific sequence, or that the red square is an intermediate step.