## Diagram: Reinforcement Learning Experiment Phases and Reward Progression
### Overview
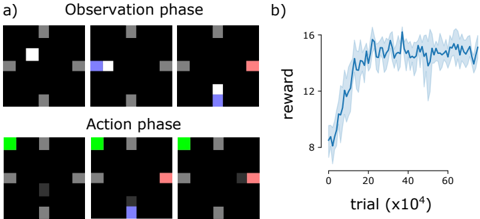
The image depicts two phases of a reinforcement learning experiment: an **Observation phase** (top) and an **Action phase** (bottom), accompanied by a line graph showing reward progression over trials. The experiment involves colored squares moving within a grid environment, with rewards tracked across 60,000 trials (x10⁴).
---
### Components/Axes
#### Observation Phase (a)
- **Grid Layout**: 3x3 grid with static gray squares at corners and edges.
- **Dynamic Elements**:
- **White Square**: Appears in top-left (first image), middle-left (second), and bottom-right (third) positions.
- **Blue Square**: Appears in middle-left (second image) and bottom-right (third image).
- **Red Square**: Appears in bottom-right (third image).
- **Action Phase (a)**:
- **Green Square**: Top-left (first image).
- **Blue Square**: Middle-left (second image).
- **Red Square**: Bottom-right (third image).
- **Legend**: Located in the bottom-right of the Action phase images, mapping colors to actions:
- **Green**: Correct action.
- **Blue**: Neutral action.
- **Red**: Incorrect action.
#### Line Graph (b)
- **X-Axis**: "trial (x10⁴)" with increments from 0 to 60,000.
- **Y-Axis**: "reward" scaled from 8 to 16.
- **Data Series**: Single blue line with shaded area (confidence interval or variability).
---
### Detailed Analysis
#### Observation Phase
- **Stimuli**: The white square moves from top-left to bottom-right across the three images, suggesting a target or goal location.
- **Distractors**: Blue and red squares appear in intermediate positions, possibly representing obstacles or competing stimuli.
#### Action Phase
- **Agent Actions**:
- **Green Square**: Top-left (correct action, likely aligning with the target).
- **Blue Square**: Middle-left (neutral action, partial alignment).
- **Red Square**: Bottom-right (incorrect action, misaligned with target).
- **Spatial Relationship**: The agent’s actions (green/blue/red squares) correspond to the target’s position in the Observation phase, indicating a learning task where the agent must predict or react to the target’s location.
#### Line Graph
- **Trend**:
- **Initial Phase (0–20,000 trials)**: Reward increases sharply from ~8 to ~16.
- **Plateau Phase (20,000–60,000 trials)**: Reward stabilizes around 14–16 with minor fluctuations.
- **Variability**: Shaded area indicates standard deviation, showing higher uncertainty in early trials (0–20,000) and reduced variability later.
---
### Key Observations
1. **Reward Progression**: The agent’s performance improves significantly in the first 20,000 trials, followed by stabilization.
2. **Action-Outcome Mapping**:
- Green (correct) actions align with the target’s final position (bottom-right).
- Red (incorrect) actions misalign with the target’s trajectory.
3. **Temporal Dynamics**: Early trials show high variability, suggesting exploration or learning instability, while later trials reflect learned behavior.
---
### Interpretation
- **Learning Curve**: The sharp initial increase in reward demonstrates rapid skill acquisition, while the plateau indicates near-optimal performance. The shaded area reflects the agent’s exploration-exploitation trade-off, with reduced uncertainty as learning progresses.
- **Action-Phase Design**: The color-coded actions (green/blue/red) likely represent a policy where the agent learns to associate observations (target positions) with optimal actions. The red square’s placement in the bottom-right (third image) suggests a failure to adapt to the target’s movement.
- **Experimental Insight**: The grid environment and reward structure imply a task requiring spatial reasoning and temporal prediction. The agent’s ability to generalize from observed patterns (e.g., target movement) to actionable strategies is critical to its success.
---
### Spatial Grounding
- **Legend**: Bottom-right of Action phase images.
- **Line Graph**: Positioned to the right of the grid phases, with the x-axis spanning 0–60,000 trials and y-axis 8–16 reward.
### Uncertainties
- Exact numerical values for reward at specific trials are approximated due to the shaded area’s variability. For example, at 40,000 trials, the reward is ~15.5 ± 0.5.