## Scatter Plot: Top-1 Accuracy vs. Joules
### Overview
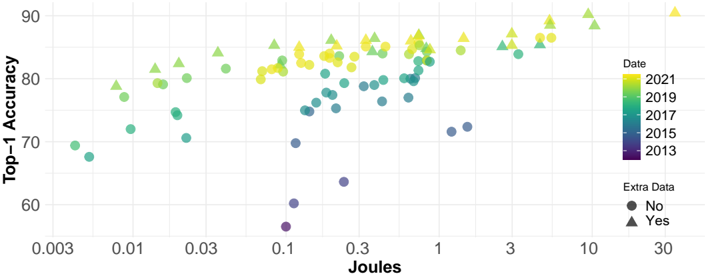
The image is a scatter plot showing the relationship between Top-1 Accuracy and Joules, with data points differentiated by date (2013, 2015, 2017, 2019, 2021) and the presence of "Extra Data" (Yes/No). The x-axis (Joules) is on a logarithmic scale.
### Components/Axes
* **Title:** None explicitly present in the image.
* **X-axis:**
* Label: "Joules"
* Scale: Logarithmic
* Markers: 0.003, 0.01, 0.03, 0.1, 0.3, 1, 3, 10, 30
* **Y-axis:**
* Label: "Top-1 Accuracy"
* Scale: Linear
* Markers: 60, 70, 80, 90
* **Legend:** Located in the top-right corner.
* **Date:**
* 2021: Yellow
* 2019: Light Green
* 2017: Green
* 2015: Dark Green/Teal
* 2013: Purple/Dark Blue
* **Extra Data:**
* No: Circle
* Yes: Triangle
### Detailed Analysis
The data points are scattered across the plot, with a general trend of increasing Top-1 Accuracy as Joules increase. The color of the data points indicates the year, and the shape indicates whether "Extra Data" is present.
* **2013 (Purple/Dark Blue):** The data points are clustered at the lower-left of the plot, indicating lower Joules and lower Top-1 Accuracy.
* At 0.1 Joules, accuracy is approximately 56% with no extra data (circle).
* At 0.3 Joules, accuracy is approximately 63% with no extra data (circle).
* **2015 (Dark Green/Teal):** The data points are located in the middle of the plot.
* At 0.1 Joules, accuracy is approximately 70% with no extra data (circle).
* At 0.3 Joules, accuracy is approximately 75% with no extra data (circle).
* **2017 (Green):** The data points are located in the middle to upper-middle of the plot.
* At 0.01 Joules, accuracy is approximately 69% with no extra data (circle).
* At 0.03 Joules, accuracy is approximately 72% with no extra data (circle).
* At 0.1 Joules, accuracy is approximately 82% with extra data (triangle).
* **2019 (Light Green):** The data points are located in the upper-middle of the plot.
* At 0.01 Joules, accuracy is approximately 78% with extra data (triangle).
* At 0.03 Joules, accuracy is approximately 82% with extra data (triangle).
* At 0.1 Joules, accuracy is approximately 83% with extra data (triangle).
* **2021 (Yellow):** The data points are located in the upper-right of the plot, indicating higher Joules and higher Top-1 Accuracy.
* At 0.1 Joules, accuracy is approximately 82% with extra data (triangle).
* At 1 Joules, accuracy is approximately 85% with extra data (triangle).
* At 10 Joules, accuracy is approximately 88% with extra data (triangle).
### Key Observations
* There is a general positive correlation between Joules and Top-1 Accuracy.
* The data points from later years (2019, 2021) tend to have higher Top-1 Accuracy for a given Joules value compared to earlier years (2013, 2015).
* The presence of "Extra Data" (triangle markers) seems to be associated with higher Top-1 Accuracy.
* The data points for 2013 are clustered at the lower end of both axes, indicating lower performance.
### Interpretation
The scatter plot suggests that, over time, models have become more energy-efficient, achieving higher Top-1 Accuracy with lower Joules. The "Extra Data" likely represents additional techniques or features that improve model performance. The trend indicates advancements in model design and training methodologies, leading to better accuracy with less energy consumption. The logarithmic scale on the x-axis suggests that the relationship between Joules and Top-1 Accuracy may not be linear, and there might be diminishing returns as Joules increase.