## Scatter Plot: Top-1 Accuracy vs Joules with Date and Extra Data Indicators
### Overview
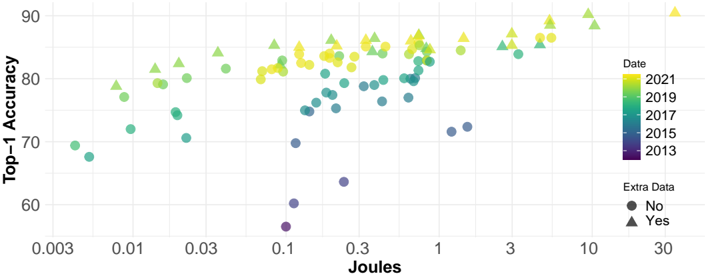
The image is a scatter plot visualizing the relationship between **Top-1 Accuracy** (y-axis) and **Joules** (x-axis) across different years (2013–2021). Data points are color-coded by year and marked with either circles (no extra data) or triangles (extra data). The plot emphasizes trends in model performance over time and the impact of additional data.
---
### Components/Axes
- **X-axis (Joules)**: Logarithmic scale ranging from **0.003** to **30**, with gridlines at intervals of 0.003, 0.01, 0.03, 0.1, 0.3, 1, 3, 10, and 30.
- **Y-axis (Top-1 Accuracy)**: Linear scale from **50** to **90**, with gridlines at 10-unit intervals.
- **Legend**:
- **Color Gradient**: Represents the year of data collection, transitioning from **purple (2013)** to **yellow (2021)**.
- **Markers**:
- **Circles**: No extra data.
- **Triangles**: Extra data included.
- **Placement**: Right-aligned, vertically stacked with color gradient above marker symbols.
---
### Detailed Analysis
1. **Data Distribution**:
- **Low Joules (0.003–0.1)**:
- Accuracy ranges from **65–75%**.
- Dominated by older years (2013–2015, purple/blue points).
- Fewer data points with extra data (triangles).
- **Mid Joules (0.1–1)**:
- Accuracy improves to **75–85%**.
- Mix of years (2015–2019, blue/green/yellow points).
- More triangles (extra data) appear here.
- **High Joules (1–30)**:
- Accuracy peaks at **85–90%**.
- Newer years (2019–2021, green/yellow points) dominate.
- Triangles (extra data) are prevalent, especially at higher Joules.
2. **Trends**:
- **Positive Correlation**: Higher Joules generally correspond to higher Top-1 Accuracy.
- **Extra Data Impact**: Triangles (extra data) consistently outperform circles (no extra data) across all Joules ranges.
- **Yearly Progression**: Newer years (2019–2021) show higher accuracy for similar Joules values compared to older years.
3. **Notable Outliers**:
- A single purple circle (2013, no extra data) at **Joules = 0.1** and **Accuracy = 55%** is the lowest-performing point.
- A yellow triangle (2021, extra data) at **Joules = 30** achieves **90% accuracy**, the highest point.
---
### Key Observations
- **Extra Data Significance**: The presence of extra data (triangles) consistently improves accuracy, especially at higher Joules values.
- **Yearly Improvements**: Models from 2019–2021 outperform earlier years, even at lower Joules.
- **Diminishing Returns**: Accuracy plateaus near **90%** for Joules > 10, suggesting limited gains from further resource investment.
---
### Interpretation
The plot demonstrates that **model performance improves with increased computational resources (Joules)** and **additional data**. The color gradient highlights advancements over time, with newer years achieving higher accuracy for comparable Joules. The dominance of triangles (extra data) underscores its critical role in enhancing results. The outlier at 55% accuracy (2013, no extra data) emphasizes the baseline performance without these enhancements. This suggests that optimizing both resource allocation and data quality is essential for maximizing Top-1 Accuracy.