## Scatter Plot: Miscellaneous Confidence vs. Target Length
### Overview
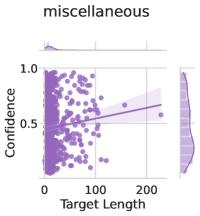
The image is a scatter plot showing the relationship between "Confidence" and "Target Length". The plot includes a regression line with a confidence interval, and marginal density plots for each variable. The data points are clustered, and the regression line suggests a slightly positive correlation between the two variables.
### Components/Axes
* **Title:** miscellaneous
* **X-axis:** Target Length
* Scale: 0 to approximately 225
* Ticks: 0, 100, 200
* **Y-axis:** Confidence
* Scale: 0 to 1.0
* Ticks: 0.0, 0.5, 1.0
* **Data Points:** Purple dots representing individual data points.
* **Regression Line:** A purple line showing the linear regression fit to the data.
* **Confidence Interval:** A shaded purple region around the regression line, representing the confidence interval.
* **Marginal Density Plots:**
* Top: Density plot of Target Length.
* Right: Density plot of Confidence.
### Detailed Analysis
* **Data Point Distribution:** The data points are concentrated near the lower end of the "Target Length" axis (around 0-50) and are more spread out in terms of "Confidence".
* **Regression Line:** The regression line has a slight positive slope, indicating a weak positive correlation between "Target Length" and "Confidence".
* **Confidence Interval:** The confidence interval widens as "Target Length" increases, suggesting greater uncertainty in the regression fit for larger target lengths.
* **Marginal Density Plots:**
* Target Length: The density plot shows a high concentration of data points at lower target lengths, with a long tail extending to higher values.
* Confidence: The density plot shows a bimodal distribution, with peaks around 0.1 and 0.6.
### Key Observations
* The majority of data points have a "Target Length" of less than 100.
* There is a wide range of "Confidence" values for smaller "Target Lengths".
* The positive correlation between "Target Length" and "Confidence" is weak.
### Interpretation
The scatter plot suggests that there is a slight tendency for "Confidence" to increase as "Target Length" increases, but the relationship is not strong. The concentration of data points at lower "Target Lengths" indicates that most of the data falls within this range. The bimodal distribution of "Confidence" suggests that there may be two distinct groups of data points with different confidence levels. The widening confidence interval for larger "Target Lengths" indicates that the regression fit is less reliable for these values. Overall, the plot provides limited evidence of a strong relationship between "Confidence" and "Target Length".