## Scatter Plot: Confidence vs. Target Length
### Overview
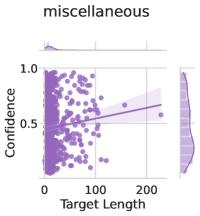
The image is a scatter plot titled "miscellaneous" showing the relationship between "Target Length" (x-axis) and "Confidence" (y-axis). A line of best fit with a shaded confidence interval is overlaid on the data points. The plot uses purple for data points and the trend line, with a light purple shaded region around the line.
### Components/Axes
- **Title**: "miscellaneous" (top-center)
- **X-axis**:
- Label: "Target Length"
- Scale: 0 to 200 (increments of 100)
- Position: Bottom
- **Y-axis**:
- Label: "Confidence"
- Scale: 0.0 to 1.0 (increments of 0.5)
- Position: Left
- **Data Series**:
- **Purple Scatter Points**: ~150 data points distributed across the plot.
- **Line of Best Fit**: Slightly upward-sloping, darker purple than data points.
- **Confidence Interval**: Light purple shaded region ±~0.05 around the line (approximate width).
### Detailed Analysis
- **Data Points**:
- Clustered densely near the lower-left (low Target Length, high Confidence).
- Spread becomes sparser and more variable as Target Length increases.
- No explicit legend, but the line and shaded area are visually linked to the data series.
- **Line of Best Fit**:
- Slope: ~0.005 (estimated from visual inspection; weak positive trend).
- Intercept: ~0.5 (approximate y-intercept at Target Length = 0).
- **Confidence Interval**:
- Width: ~0.1 (total range, ±0.05 from the line).
- Expands slightly at higher Target Length values.
### Key Observations
1. **Positive Correlation**: Weak upward trend suggests Confidence increases marginally with Target Length.
2. **High Variability**: Data points deviate significantly from the line, especially at Target Length > 100.
3. **Confidence Interval Behavior**: The shaded region widens slightly at higher Target Lengths, indicating increased uncertainty.
4. **Outlier**: A single data point at Target Length ~50 with Confidence ~0.95 lies far above the trend line.
### Interpretation
The plot suggests a **weak positive relationship** between Target Length and Confidence, but the high variability (large residuals) and expanding confidence interval imply that longer Target Lengths do not reliably predict higher Confidence. The outlier at Target Length ~50 may indicate an anomaly or a special case. The shaded confidence interval highlights the uncertainty in the trend, particularly at higher Target Length values. This could reflect challenges in modeling or external factors influencing Confidence that are not captured by Target Length alone.