## Chart: Best-of-N: MATH-500
### Overview
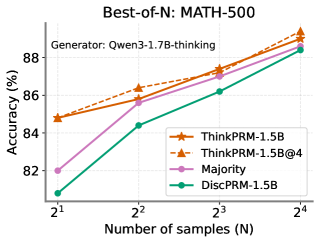
The image is a line chart comparing the accuracy of different models (ThinkPRM-1.5B, ThinkPRM-1.5B@4, Majority, and DiscPRM-1.5B) on the MATH-500 dataset, with varying numbers of samples (N). The generator used is Qwen3-1.7B-thinking.
### Components/Axes
* **Title:** Best-of-N: MATH-500
* **Subtitle:** Generator: Qwen3-1.7B-thinking
* **X-axis:** Number of samples (N), with values 2<sup>1</sup>, 2<sup>2</sup>, 2<sup>3</sup>, 2<sup>4</sup>, which correspond to 2, 4, 8, and 16 samples respectively.
* **Y-axis:** Accuracy (%), ranging from 82% to 88%.
* **Legend:** Located on the right side of the chart.
* ThinkPRM-1.5B (Orange line with triangle markers)
* ThinkPRM-1.5B@4 (Dashed orange line with triangle markers)
* Majority (Pink line with circle markers)
* DiscPRM-1.5B (Teal line with circle markers)
### Detailed Analysis
* **ThinkPRM-1.5B (Orange line with triangle markers):** The accuracy increases as the number of samples increases.
* At 2<sup>1</sup> (2 samples), the accuracy is approximately 84.8%.
* At 2<sup>2</sup> (4 samples), the accuracy is approximately 86.2%.
* At 2<sup>3</sup> (8 samples), the accuracy is approximately 87.2%.
* At 2<sup>4</sup> (16 samples), the accuracy is approximately 89.2%.
* **ThinkPRM-1.5B@4 (Dashed orange line with triangle markers):** The accuracy increases as the number of samples increases.
* At 2<sup>1</sup> (2 samples), the accuracy is approximately 84.8%.
* At 2<sup>2</sup> (4 samples), the accuracy is approximately 85.8%.
* At 2<sup>3</sup> (8 samples), the accuracy is approximately 87.5%.
* At 2<sup>4</sup> (16 samples), the accuracy is approximately 88.8%.
* **Majority (Pink line with circle markers):** The accuracy increases as the number of samples increases.
* At 2<sup>1</sup> (2 samples), the accuracy is approximately 82.0%.
* At 2<sup>2</sup> (4 samples), the accuracy is approximately 85.5%.
* At 2<sup>3</sup> (8 samples), the accuracy is approximately 87.0%.
* At 2<sup>4</sup> (16 samples), the accuracy is approximately 88.5%.
* **DiscPRM-1.5B (Teal line with circle markers):** The accuracy increases as the number of samples increases.
* At 2<sup>1</sup> (2 samples), the accuracy is approximately 81.0%.
* At 2<sup>2</sup> (4 samples), the accuracy is approximately 84.3%.
* At 2<sup>3</sup> (8 samples), the accuracy is approximately 87.0%.
* At 2<sup>4</sup> (16 samples), the accuracy is approximately 88.8%.
### Key Observations
* All models show an increase in accuracy as the number of samples increases.
* ThinkPRM-1.5B and ThinkPRM-1.5B@4 generally outperform the Majority and DiscPRM-1.5B models.
* The ThinkPRM-1.5B model has the highest accuracy at 16 samples.
* The DiscPRM-1.5B model has the lowest accuracy at 2 samples.
### Interpretation
The chart demonstrates the impact of increasing the number of samples (N) on the accuracy of different models when solving math problems from the MATH-500 dataset. The ThinkPRM-1.5B model appears to be the most effective, achieving the highest accuracy with a larger number of samples. The performance difference between the models suggests variations in their problem-solving capabilities and how they leverage multiple samples to improve accuracy. The "Best-of-N" approach generally improves accuracy for all models, indicating that generating multiple solutions and selecting the best one is a beneficial strategy.