## Line Chart: Best-of-N: MATH-500
### Overview
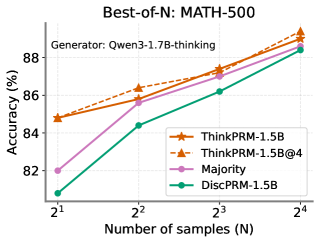
This line chart displays the accuracy of different models on the MATH-500 dataset as a function of the number of samples (N) used in a "Best-of-N" approach. The x-axis represents the number of samples, expressed as powers of 2 (2<sup>1</sup> to 2<sup>4</sup>), and the y-axis represents the accuracy in percentage. The chart compares the performance of four models: ThinkPRM-1.5B, ThinkPRM-1.5B@4, Majority, and DiscPRM-1.5B.
### Components/Axes
* **Title:** Best-of-N: MATH-500
* **Subtitle:** Generator: Qwen3-1.7B-thinking
* **X-axis Label:** Number of samples (N)
* **X-axis Markers:** 2<sup>1</sup>, 2<sup>2</sup>, 2<sup>3</sup>, 2<sup>4</sup>
* **Y-axis Label:** Accuracy (%)
* **Legend:**
* ThinkPRM-1.5B (Orange, dashed line with triangle markers)
* ThinkPRM-1.5B@4 (Dark Orange, dashed line with square markers)
* Majority (Purple, solid line with circle markers)
* DiscPRM-1.5B (Teal, solid line with diamond markers)
### Detailed Analysis
The chart shows four lines representing the accuracy of each model as the number of samples increases.
* **ThinkPRM-1.5B (Orange):** The line slopes upward, indicating increasing accuracy with more samples.
* At 2<sup>1</sup> (N=2): Approximately 84.7% accuracy.
* At 2<sup>2</sup> (N=4): Approximately 86.2% accuracy.
* At 2<sup>3</sup> (N=8): Approximately 87.2% accuracy.
* At 2<sup>4</sup> (N=16): Approximately 89.1% accuracy.
* **ThinkPRM-1.5B@4 (Dark Orange):** The line also slopes upward, generally above ThinkPRM-1.5B.
* At 2<sup>1</sup> (N=2): Approximately 85.2% accuracy.
* At 2<sup>2</sup> (N=4): Approximately 86.7% accuracy.
* At 2<sup>3</sup> (N=8): Approximately 87.8% accuracy.
* At 2<sup>4</sup> (N=16): Approximately 89.4% accuracy.
* **Majority (Purple):** The line slopes upward, starting lower than the ThinkPRM models but converging towards the higher values.
* At 2<sup>1</sup> (N=2): Approximately 82.5% accuracy.
* At 2<sup>2</sup> (N=4): Approximately 84.2% accuracy.
* At 2<sup>3</sup> (N=8): Approximately 86.2% accuracy.
* At 2<sup>4</sup> (N=16): Approximately 88.8% accuracy.
* **DiscPRM-1.5B (Teal):** The line slopes upward, starting at the lowest accuracy and consistently increasing with more samples.
* At 2<sup>1</sup> (N=2): Approximately 81.2% accuracy.
* At 2<sup>2</sup> (N=4): Approximately 83.2% accuracy.
* At 2<sup>3</sup> (N=8): Approximately 85.2% accuracy.
* At 2<sup>4</sup> (N=16): Approximately 88.2% accuracy.
### Key Observations
* All models show improved accuracy as the number of samples increases.
* ThinkPRM-1.5B@4 consistently outperforms ThinkPRM-1.5B.
* The "Majority" model starts with lower accuracy but shows a significant improvement with more samples, approaching the performance of the ThinkPRM models.
* DiscPRM-1.5B consistently has the lowest accuracy across all sample sizes.
* The differences in accuracy between the models become less pronounced at higher sample sizes (N=16).
### Interpretation
The data suggests that a "Best-of-N" approach is effective in improving the accuracy of these models on the MATH-500 dataset. Increasing the number of samples (N) leads to better performance for all models. The ThinkPRM-1.5B@4 model appears to be the most robust, consistently achieving the highest accuracy. The "Majority" model demonstrates that a simple ensemble method can be competitive, especially with a larger number of samples. The performance gap between the models narrows as N increases, indicating that all models benefit from more data, but some are more sensitive to sample size than others. The generator used, Qwen3-1.7B-thinking, provides context for the models being evaluated. This chart is a comparative analysis of different model architectures and sampling strategies for solving mathematical problems.