## Line Chart: Best-of-N: MATH-500
### Overview
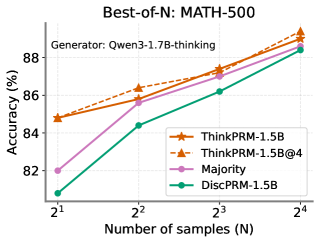
The chart illustrates the relationship between the number of samples (N) and accuracy (%) for four different methods evaluated on the MATH-500 dataset. The x-axis represents the number of samples in powers of two (2¹ to 2⁴), while the y-axis shows accuracy percentages ranging from 82% to 88%. Four data series are plotted, with distinct line styles and markers corresponding to different methods.
### Components/Axes
- **X-axis (Number of samples (N))**:
- Labels: 2¹, 2², 2³, 2⁴ (values: 2, 4, 8, 16)
- Scale: Logarithmic progression (powers of 2)
- **Y-axis (Accuracy (%))**:
- Labels: 82%, 84%, 86%, 88%
- Scale: Linear increments of 2%
- **Legend**:
- Position: Bottom-right corner
- Entries:
- Orange line with star markers: ThinkPRM-1.5B
- Dashed orange line with triangle markers: ThinkPRM-1.5B@4
- Pink line with circle markers: Majority
- Green line with diamond markers: DiscPRM-1.5B
- **Title**: "Best-of-N: MATH-500" (top-center)
- **Subtitle**: "Generator: Qwen3-1.7B-thinking" (top-left)
### Detailed Analysis
1. **ThinkPRM-1.5B (Orange, Star Markers)**:
- Starts at ~84.5% accuracy at N=2 (2¹)
- Increases steadily to ~89% at N=16 (2⁴)
- Slope: Consistent upward trend
2. **ThinkPRM-1.5B@4 (Dashed Orange, Triangle Markers)**:
- Begins at ~85% at N=2
- Reaches ~89.5% at N=16
- Slope: Slightly steeper than ThinkPRM-1.5B
3. **Majority (Pink, Circle Markers)**:
- Starts at ~82% at N=2
- Rises to ~88.5% at N=16
- Slope: Gradual increase
4. **DiscPRM-1.5B (Green, Diamond Markers)**:
- Begins at ~81% at N=2
- Ends at ~88.5% at N=16
- Slope: Steady improvement
### Key Observations
- All methods show **increasing accuracy** as the number of samples grows.
- **ThinkPRM-1.5B@4** consistently outperforms other methods across all sample sizes.
- **Majority** and **DiscPRM-1.5B** exhibit similar performance trajectories, with DiscPRM-1.5B starting slightly lower but converging near N=16.
- The **dashed orange line (ThinkPRM-1.5B@4)** has the highest accuracy at every data point.
### Interpretation
The data demonstrates that **sample size (N)** significantly impacts model performance on the MATH-500 benchmark. The "Best-of-N" approach (ThinkPRM-1.5B@4) achieves the highest accuracy, suggesting that evaluating multiple samples and selecting the best result improves reliability. The **Majority** method, likely a baseline, shows moderate improvement, while **DiscPRM-1.5B** performs comparably but starts from a lower baseline. The generator "Qwen3-1.7B-thinking" indicates the underlying model used for these evaluations. The logarithmic scaling of N emphasizes performance gains at exponential sample increases, highlighting efficiency trade-offs in practical applications.