## Heatmap Matrix: Qwen2.5 R1 7B Activation and Variance Analysis
### Overview
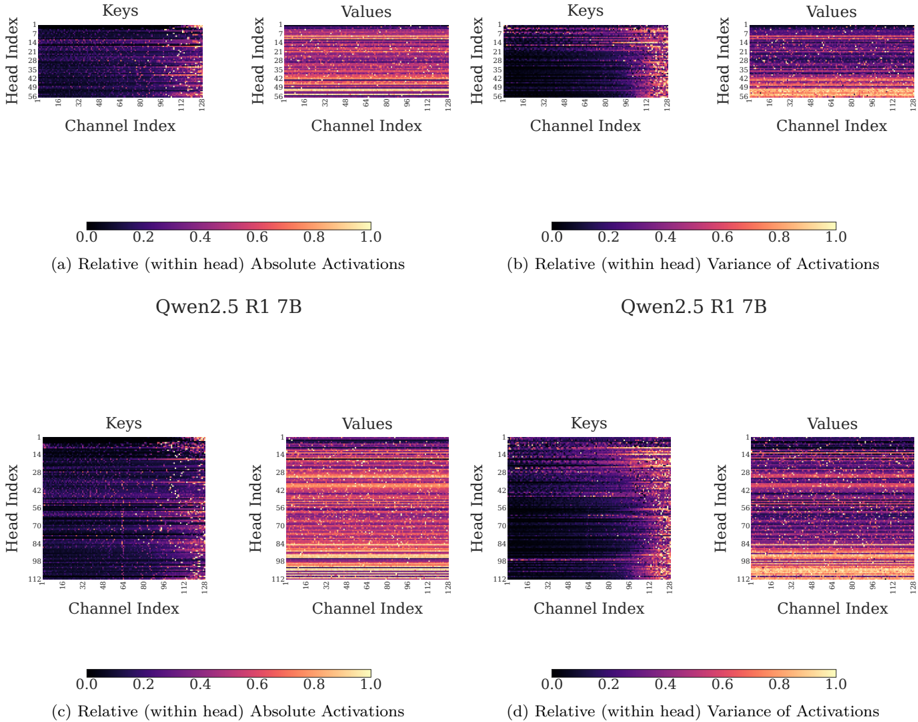
The image presents a composite figure containing four distinct sub-panels, labeled (a), (b), (c), and (d). Each sub-panel consists of two heatmaps side-by-side, representing the "Keys" and "Values" components of the Qwen2.5 R1 7B model. The heatmaps visualize the "Relative (within head) Absolute Activations" (panels a and c) and "Relative (within head) Variance of Activations" (panels b and d) across different Head Indices and Channel Indices.
### Components/Axes
* **Color Scale (Legend):** A gradient scale from 0.0 (black) to 1.0 (light yellow/white), representing the magnitude of activation or variance.
* **X-Axis (All Heatmaps):** "Channel Index," ranging from 1 to 128.
* **Y-Axis (Head Index):**
* **Top Row (a, b):** Ranges from 1 to 56.
* **Bottom Row (c, d):** Ranges from 1 to 112.
* **Labels:**
* **Top Row:**
* (a) Relative (within head) Absolute Activations
* (b) Relative (within head) Variance of Activations
* **Bottom Row:**
* (c) Relative (within head) Absolute Activations
* (d) Relative (within head) Variance of Activations
* **Model Identifier:** "Qwen2.5 R1 7B" is centered between the top and bottom rows.
### Detailed Analysis
#### 1. Keys Heatmaps (Left side of each panel)
* **Visual Trend:** Across all four panels (a, b, c, d), the "Keys" heatmaps exhibit a consistent, sharp gradient. The left side (Channel Indices 1–80) is predominantly dark (values near 0.0–0.2), indicating low activation or variance. There is a transition zone around Channel Index 80–96, leading to high intensity (values near 0.8–1.0) on the right side (Channel Indices 96–128).
* **Data Points:**
* **Low Intensity Region:** Channels 1–80 are consistently dark across all Head Indices.
* **High Intensity Region:** Channels 96–128 show high-intensity clusters, appearing as a "tail" of activation.
#### 2. Values Heatmaps (Right side of each panel)
* **Visual Trend:** Across all four panels, the "Values" heatmaps show a stark contrast to the "Keys." They are predominantly bright (values near 0.6–1.0) across the entire width of the Channel Index (1–128).
* **Data Points:**
* **Intensity:** The heatmaps are saturated with light colors, suggesting that "Values" utilize the full channel capacity relatively uniformly compared to "Keys."
* **Structure:** There is some horizontal striping (variation across Head Indices), but the channel-wise distribution is dense and high-magnitude.
### Key Observations
* **Structural Asymmetry:** There is a clear, consistent architectural distinction between "Keys" and "Values." The "Keys" projection is highly sparse or selective regarding channel usage, concentrating energy in the higher channel indices. Conversely, "Values" are dense and distributed across the entire channel dimension.
* **Consistency:** The patterns for "Absolute Activations" (a, c) and "Variance of Activations" (b, d) are visually nearly identical. This suggests that the magnitude of activation is strongly correlated with the variance of that activation within this model's architecture.
* **Scale Invariance:** The pattern holds true regardless of the Head Index range (1–56 in the top row vs. 1–112 in the bottom row), indicating this is a fundamental property of the attention heads in this model.
### Interpretation
The data demonstrates a specialized functional role for the "Keys" and "Values" projections in the Qwen2.5 R1 7B model.
The "Keys" projection appears to be highly channel-selective. By concentrating activation in the higher channel indices (the right side of the heatmap), the model likely reserves these specific channels for attention-related computations, perhaps to facilitate specific pattern matching or to maintain sparsity in the attention mechanism.
The "Values" projection, being dense and high-intensity across all channels, suggests that the model utilizes the full capacity of the value vector to represent information. This is a common design pattern in Transformer architectures, where the "Key" projection acts as a filter or query-matching mechanism (requiring sparsity/selectivity), while the "Value" projection acts as the information carrier (requiring high capacity/density). The fact that variance mirrors absolute activation suggests that the model's "active" channels are also the ones that fluctuate the most, indicating these channels are dynamic and context-dependent.