\n
## Line Chart: Mean Pass Rate vs. Mean Number of Tokens Generated
### Overview
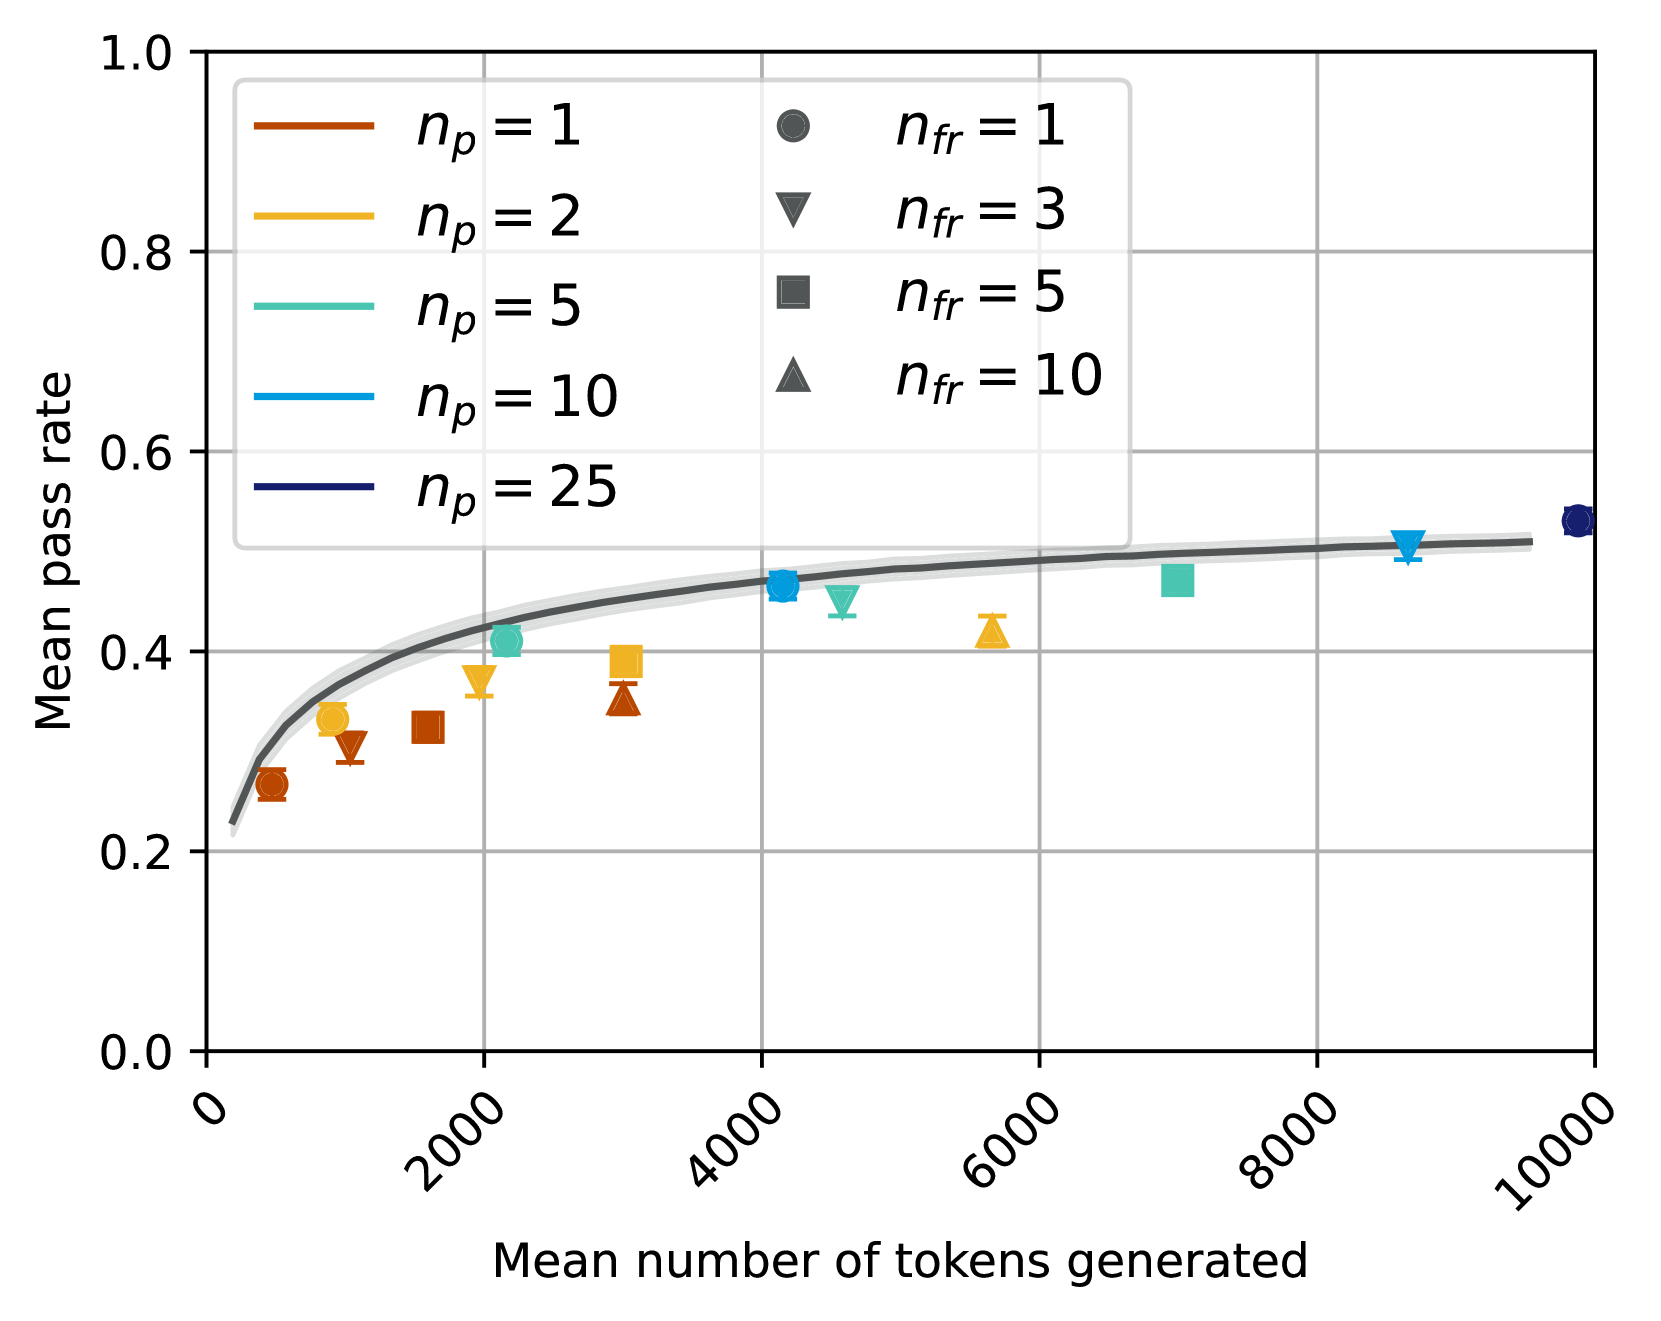
This chart displays the relationship between the mean pass rate and the mean number of tokens generated, for different values of *n<sub>p</sub>* and *n<sub>fr</sub>*. The chart uses line plots with shaded confidence intervals, and also includes individual data points for *n<sub>fr</sub>* values.
### Components/Axes
* **X-axis:** "Mean number of tokens generated" ranging from 0 to 10000, with tick marks at 0, 2000, 4000, 6000, 8000, and 10000.
* **Y-axis:** "Mean pass rate" ranging from 0.0 to 1.0, with tick marks at 0.0, 0.2, 0.4, 0.6, 0.8, and 1.0.
* **Lines:** Represent different values of *n<sub>p</sub>* (number of prompts): 1, 2, 5, 10, and 25.
* **Markers:** Represent different values of *n<sub>fr</sub>* (number of feedback rounds): 1, 3, 5, and 10.
* **Legend (Top-Right):**
* *n<sub>p</sub>* = 1 (Brown)
* *n<sub>p</sub>* = 2 (Orange)
* *n<sub>p</sub>* = 5 (Light Green)
* *n<sub>p</sub>* = 10 (Light Blue)
* *n<sub>p</sub>* = 25 (Dark Blue)
* *n<sub>fr</sub>* = 1 (Gray Circle)
* *n<sub>fr</sub>* = 3 (Dark Red Triangle)
* *n<sub>fr</sub>* = 5 (Dark Gray Square)
* *n<sub>fr</sub>* = 10 (Dark Green Triangle)
* **Gridlines:** Horizontal and vertical gridlines are present to aid in reading values.
### Detailed Analysis
The chart shows several lines representing different *n<sub>p</sub>* values. Each line is accompanied by a shaded region, presumably representing a confidence interval. Individual data points for different *n<sub>fr</sub>* values are also plotted.
* **n<sub>p</sub> = 1 (Brown):** The line starts at approximately 0.23 at x=0, rises sharply to around 0.38 at x=2000, then plateaus around 0.42-0.45 for x > 4000.
* **n<sub>p</sub> = 2 (Orange):** The line starts at approximately 0.23 at x=0, rises to around 0.35 at x=2000, and then plateaus around 0.40-0.42 for x > 4000.
* **n<sub>p</sub> = 5 (Light Green):** The line starts at approximately 0.23 at x=0, rises to around 0.38 at x=2000, and then plateaus around 0.45-0.48 for x > 4000.
* **n<sub>p</sub> = 10 (Light Blue):** The line starts at approximately 0.23 at x=0, rises to around 0.42 at x=2000, and then plateaus around 0.50-0.53 for x > 4000.
* **n<sub>p</sub> = 25 (Dark Blue):** The line starts at approximately 0.23 at x=0, rises to around 0.48 at x=2000, and then plateaus around 0.55-0.58 for x > 4000.
**Data Points (n<sub>fr</sub>):**
* **n<sub>fr</sub> = 1 (Gray Circle):** (x ≈ 1000, y ≈ 0.32), (x ≈ 9000, y ≈ 0.53)
* **n<sub>fr</sub> = 3 (Dark Red Triangle):** (x ≈ 2000, y ≈ 0.38), (x ≈ 6000, y ≈ 0.47)
* **n<sub>fr</sub> = 5 (Dark Gray Square):** (x ≈ 4000, y ≈ 0.43), (x ≈ 8000, y ≈ 0.51)
* **n<sub>fr</sub> = 10 (Dark Green Triangle):** (x ≈ 6000, y ≈ 0.45), (x ≈ 10000, y ≈ 0.55)
### Key Observations
* The mean pass rate generally increases with the number of tokens generated, but the rate of increase diminishes as the number of tokens grows larger.
* Increasing *n<sub>p</sub>* (number of prompts) generally leads to a higher mean pass rate, especially at higher token counts.
* The *n<sub>fr</sub>* data points appear to fall within the confidence intervals of the corresponding *n<sub>p</sub>* lines.
* The confidence intervals become wider at higher token counts, indicating greater uncertainty in the mean pass rate.
### Interpretation
The data suggests that increasing the number of prompts (*n<sub>p</sub>*) improves the mean pass rate, particularly as the number of tokens generated increases. This indicates that providing more prompts helps the model maintain a higher level of accuracy or quality as it generates more text. The diminishing returns observed at higher token counts suggest that there's a limit to the benefit of additional prompts. The number of feedback rounds (*n<sub>fr</sub>*) also appears to positively correlate with the pass rate, but the data points are relatively sparse and fall within the confidence intervals of the *n<sub>p</sub>* lines, suggesting that the effect of *n<sub>fr</sub>* is less pronounced or is already captured by the *n<sub>p</sub>* parameter. The confidence intervals widening with increasing tokens suggest that the model's performance becomes more variable as it generates longer sequences. This could be due to factors such as increased complexity or the accumulation of errors.