## Bar Charts: Training Objectives, Fine-tuning Methods, and Training Signals
### Overview
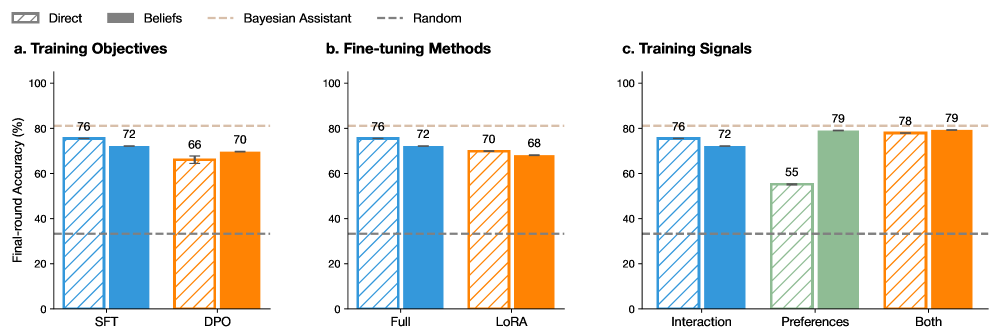
The image contains three grouped bar charts labeled **a. Training Objectives**, **b. Fine-tuning Methods**, and **c. Training Signals**. Each chart compares performance metrics (Final-round Accuracy %) across different categories and methods, with a legend indicating four data series: **Direct**, **Beliefs**, **Bayesian Assistant**, and **Random**. The charts use distinct color patterns for each series to differentiate them.
---
### Components/Axes
- **Legend**: Located at the top-left corner.
- **Direct**: Blue with diagonal stripes.
- **Beliefs**: Gray.
- **Bayesian Assistant**: Orange with diagonal stripes.
- **Random**: Dashed line.
- **X-Axes**:
- **a. Training Objectives**: Categories **SFT** and **DPO**.
- **b. Fine-tuning Methods**: Categories **Full** and **LoRA**.
- **c. Training Signals**: Categories **Interaction**, **Preferences**, and **Both**.
- **Y-Axes**: All charts share the same scale: **Final-round Accuracy (%)**, ranging from 0 to 100.
---
### Detailed Analysis
#### a. Training Objectives
- **SFT**:
- Direct: 76% (blue striped).
- Beliefs: 72% (gray).
- Bayesian Assistant: 66% (orange striped).
- Random: 70% (dashed).
- **DPO**:
- Direct: 76% (blue striped).
- Beliefs: 72% (gray).
- Bayesian Assistant: 70% (orange striped).
- Random: 68% (dashed).
#### b. Fine-tuning Methods
- **Full**:
- Direct: 76% (blue striped).
- Beliefs: 72% (gray).
- Bayesian Assistant: 70% (orange striped).
- Random: 68% (dashed).
- **LoRA**:
- Direct: 76% (blue striped).
- Beliefs: 72% (gray).
- Bayesian Assistant: 70% (orange striped).
- Random: 68% (dashed).
#### c. Training Signals
- **Interaction**:
- Direct: 76% (blue striped).
- Beliefs: 72% (gray).
- Bayesian Assistant: 70% (orange striped).
- Random: 68% (dashed).
- **Preferences**:
- Direct: 55% (blue striped).
- Beliefs: 79% (gray).
- Bayesian Assistant: 78% (orange striped).
- Random: 79% (dashed).
- **Both**:
- Direct: 76% (blue striped).
- Beliefs: 78% (gray).
- Bayesian Assistant: 79% (orange striped).
- Random: 79% (dashed).
---
### Key Observations
1. **Consistency Across Methods**:
- In **a. Training Objectives** and **b. Fine-tuning Methods**, the **Direct** and **Beliefs** methods consistently outperform **Bayesian Assistant** and **Random**.
- **DPO** and **LoRA** show identical performance to **SFT** and **Full**, respectively, suggesting no significant difference between these subcategories.
2. **Training Signals Anomalies**:
- In **c. Training Signals**, the **Preferences** category shows a sharp drop in **Direct** (55%) compared to other methods, while **Beliefs** and **Random** achieve the highest accuracy (79%).
- The **Both** category combines the highest accuracy (79%) across all methods, indicating synergy between training signals.
3. **Random Baseline**:
- The **Random** series (dashed line) consistently underperforms, with values ranging from 68% to 79%, suggesting it serves as a weak baseline.
---
### Interpretation
- **Training Objectives**:
- **Direct** and **Beliefs** methods are more effective than **Bayesian Assistant** and **Random** in both **SFT** and **DPO** settings. This implies that explicit training objectives (e.g., direct feedback) yield better results than probabilistic or random approaches.
- **Fine-tuning Methods**:
- No significant difference is observed between **Full** and **LoRA** fine-tuning methods, indicating that the choice of fine-tuning strategy may not critically impact performance under the tested conditions.
- **Training Signals**:
- **Preferences** as a training signal significantly boosts **Beliefs** and **Random** accuracy, suggesting that user preferences or implicit signals can enhance model performance.
- The **Both** category (combining interaction and preferences) achieves the highest accuracy, highlighting the value of integrating multiple training signals.
- **Outliers**:
- The **Direct** method underperforms in the **Preferences** category (55%), possibly due to misalignment between direct feedback and user preferences.
---
### Conclusion
The data demonstrates that **Direct** and **Beliefs** methods are robust across training objectives and fine-tuning strategies, while **Preferences** as a training signal can significantly improve performance when combined with other signals. The **Random** baseline consistently underperforms, reinforcing the importance of structured training approaches. The consistency in **Full** and **LoRA** fine-tuning methods suggests that architectural choices may be less critical than the training objectives and signals themselves.