## Bar Charts: Model Accuracy Comparison
### Overview
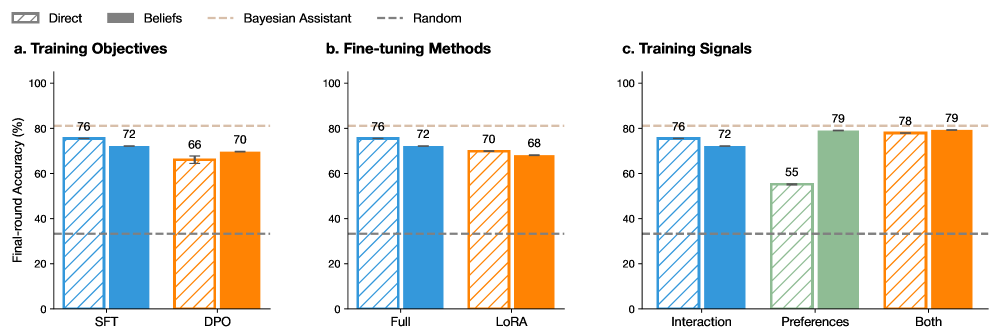
The image presents three bar charts comparing the final-round accuracy (%) of different models under varying conditions: training objectives, fine-tuning methods, and training signals. Each chart compares "Direct", "Beliefs", and "Bayesian Assistant" models against a "Random" baseline.
### Components/Axes
**Legend:** Located at the top of the image.
* Direct: Bars with diagonal lines.
* Beliefs: Solid blue bars.
* Bayesian Assistant: Solid orange bars.
* Random: Dashed gray horizontal line.
**Y-axis (all charts):**
* Label: "Final-round Accuracy (%)"
* Scale: 0 to 100, with tick marks at intervals of 20.
**Chart a. Training Objectives:**
* Title: "a. Training Objectives"
* X-axis labels: "SFT", "DPO"
**Chart b. Fine-tuning Methods:**
* Title: "b. Fine-tuning Methods"
* X-axis labels: "Full", "LoRA"
**Chart c. Training Signals:**
* Title: "c. Training Signals"
* X-axis labels: "Interaction", "Preferences", "Both"
### Detailed Analysis
**Chart a. Training Objectives:**
* **Direct (SFT):** 76%
* **Beliefs (SFT):** 72%
* **Direct (DPO):** 66%
* **Beliefs (DPO):** 70%
* **Random:** Approximately 33% (estimated from the dashed line)
**Chart b. Fine-tuning Methods:**
* **Direct (Full):** 76%
* **Beliefs (Full):** 72%
* **Direct (LoRA):** 70%
* **Beliefs (LoRA):** 68%
* **Random:** Approximately 33% (estimated from the dashed line)
**Chart c. Training Signals:**
* **Direct (Interaction):** 76%
* **Beliefs (Interaction):** 72%
* **Direct (Preferences):** 55%
* **Beliefs (Both):** 79%
* **Bayesian Assistant (Both):** 79%
* **Bayesian Assistant (Preferences):** 79%
* **Random:** Approximately 33% (estimated from the dashed line)
### Key Observations
* The "Beliefs" model consistently outperforms the "Direct" model across all training objectives and fine-tuning methods.
* Using "Both" interaction and preferences as training signals yields the highest accuracy for the "Beliefs" and "Bayesian Assistant" models.
* The "Random" baseline remains constant across all charts, providing a consistent point of comparison.
### Interpretation
The data suggests that the "Beliefs" model is more effective than the "Direct" model in these experiments. The choice of training signals significantly impacts model accuracy, with combining interaction and preferences leading to the best results. The "Random" baseline highlights the improvement gained by using the tested models and methods.