## Line Chart: Precision, Recall, and F1 Score
### Overview
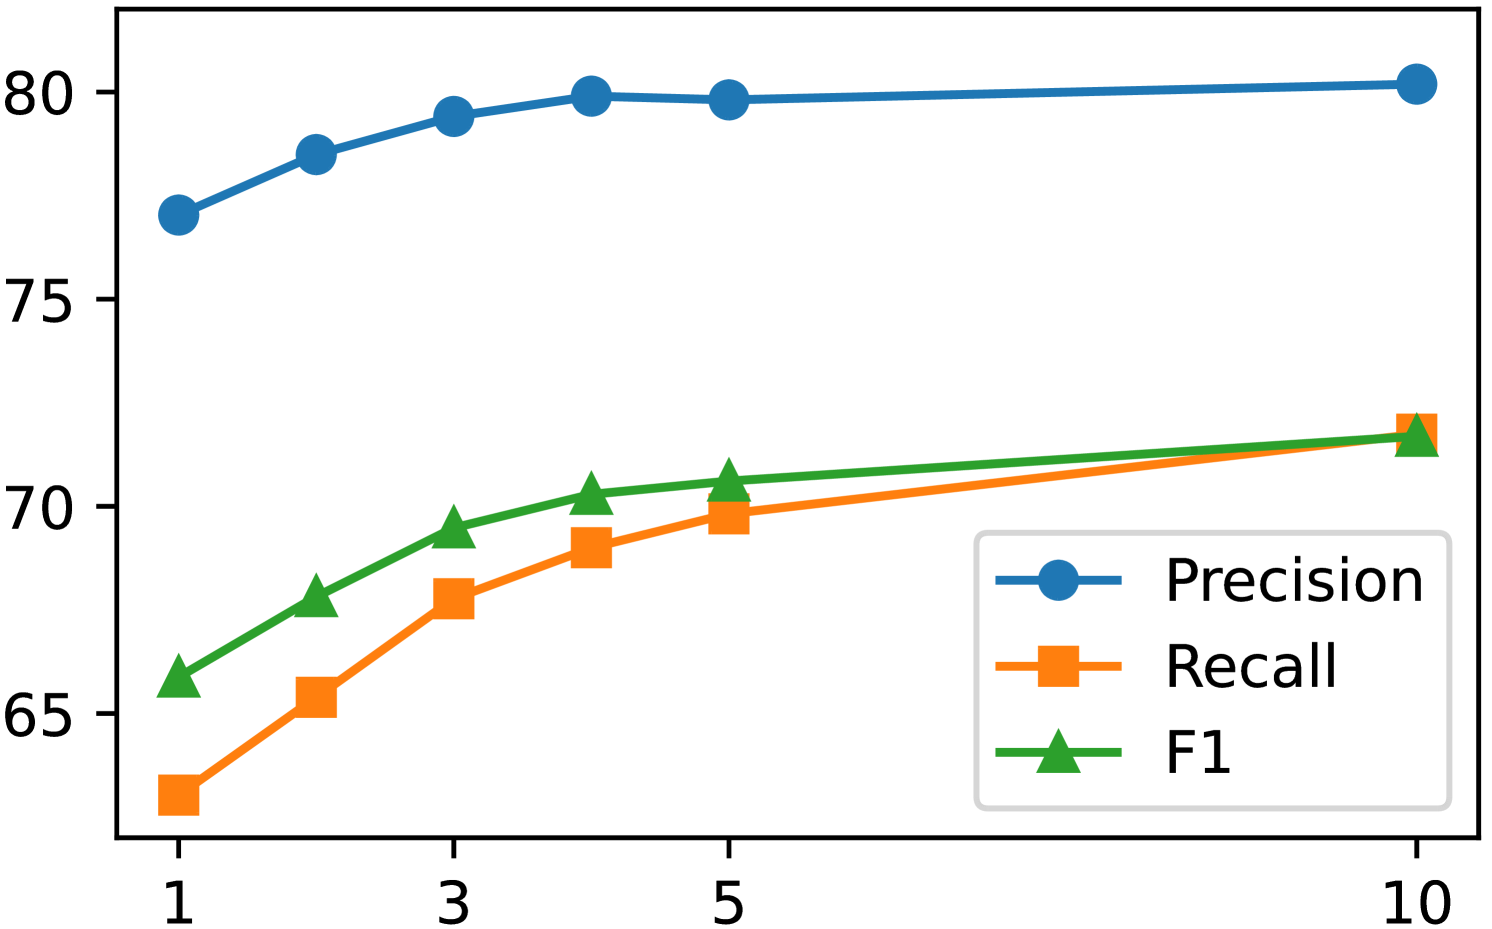
The image is a line chart comparing the performance of three metrics: Precision, Recall, and F1 score, across different values on the x-axis (1, 3, 5, 10). The chart displays how these metrics change as the x-axis value increases.
### Components/Axes
* **X-axis:** Labeled with values 1, 3, 5, and 10.
* **Y-axis:** Ranges from 65 to 80, with tick marks at 65, 70, 75, and 80.
* **Legend:** Located in the bottom-right corner, enclosed in a light gray box. It identifies the lines as follows:
* Blue line with circle markers: Precision
* Orange line with square markers: Recall
* Green line with triangle markers: F1
### Detailed Analysis
* **Precision (Blue):** The precision line starts at approximately 77 at x=1, rises to approximately 79 at x=3, remains around 80 at x=5, and stays at approximately 80 at x=10. The trend is generally increasing but plateaus after x=3.
* x=1: ~77
* x=3: ~79
* x=5: ~80
* x=10: ~80
* **Recall (Orange):** The recall line starts at approximately 63 at x=1, rises to approximately 68 at x=3, reaches approximately 70 at x=5, and ends at approximately 72 at x=10. The trend is consistently increasing.
* x=1: ~63
* x=3: ~68
* x=5: ~70
* x=10: ~72
* **F1 (Green):** The F1 line starts at approximately 66 at x=1, rises to approximately 69 at x=3, reaches approximately 70.5 at x=5, and ends at approximately 71.5 at x=10. The trend is consistently increasing.
* x=1: ~66
* x=3: ~69
* x=5: ~70.5
* x=10: ~71.5
### Key Observations
* Precision starts higher than Recall and F1 but plateaus quickly.
* Recall and F1 scores increase steadily across the x-axis values.
* At x=10, Recall and F1 are approaching Precision, but Precision remains the highest.
### Interpretation
The chart illustrates the relationship between Precision, Recall, and F1 score as the x-axis value changes. Precision initially performs well but shows diminishing returns as the x-axis value increases. Recall and F1 score, on the other hand, demonstrate consistent improvement across the range of x-axis values. This suggests that increasing the x-axis value benefits Recall and F1 more than Precision, potentially indicating a trade-off between these metrics. The specific meaning of the x-axis is not provided, so the interpretation is limited to the observed trends.