## Line Chart: Precision, Recall, and F1 Score Trends
### Overview
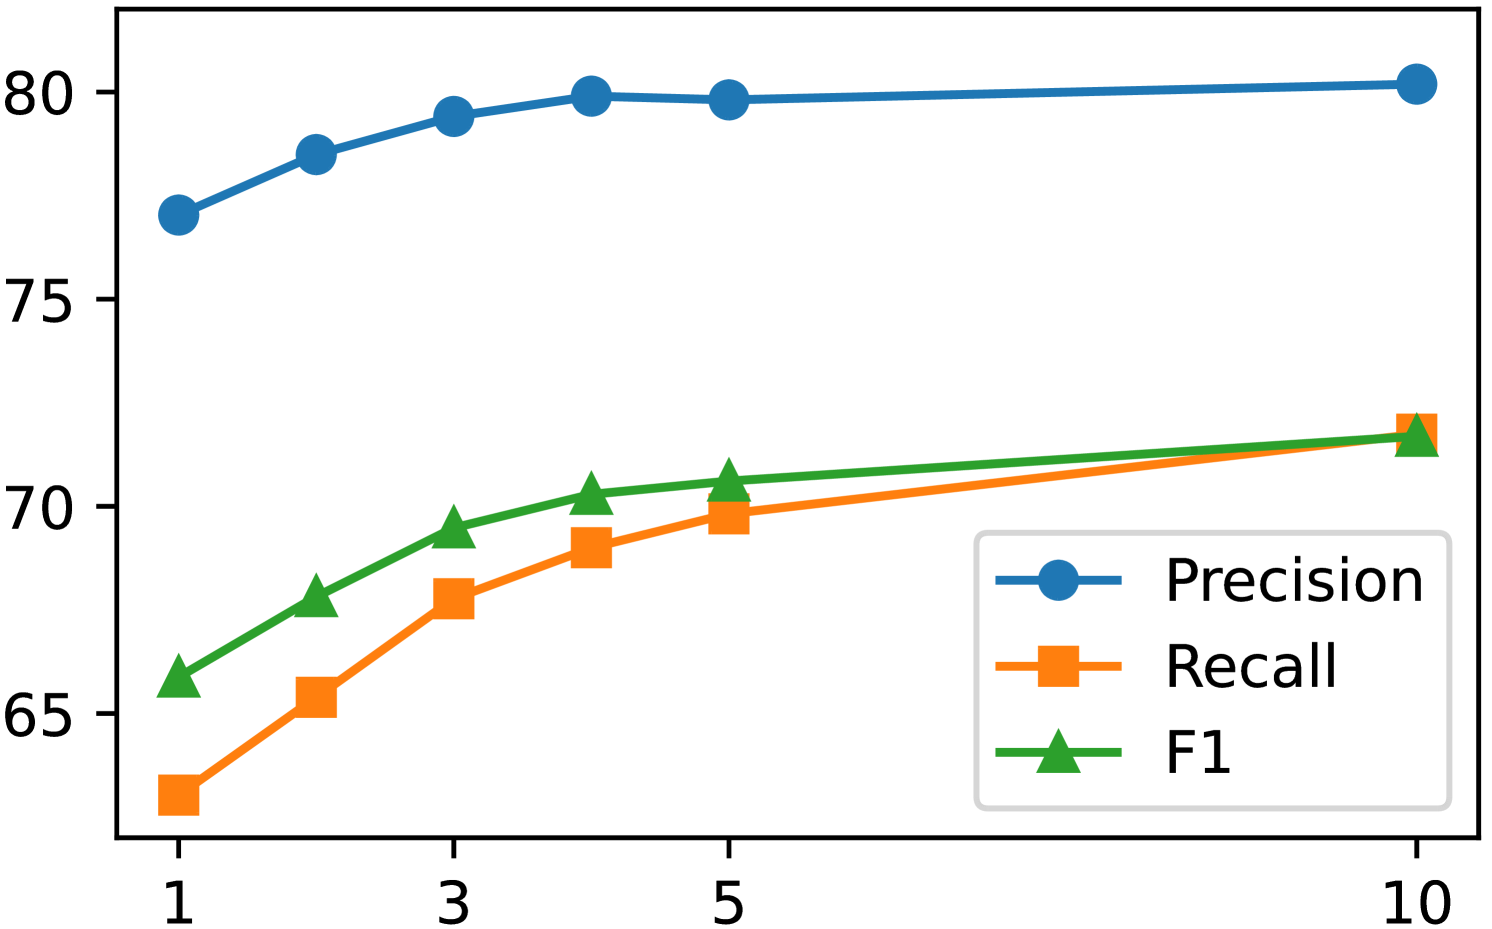
The image is a line chart displaying the performance metrics of a model or system across an increasing parameter (likely epochs, iterations, or a hyperparameter value). Three metrics are plotted: Precision, Recall, and F1 Score. All metrics show improvement as the x-axis value increases, with Precision reaching a plateau while Recall and F1 continue a steady rise.
### Components/Axes
- **X-Axis**: Numerical scale with labeled markers at **1, 3, 5, and 10**. Data points are also present at intermediate values (approximately 2 and 4). The axis is not explicitly titled, but context suggests it represents an increasing training or tuning parameter.
- **Y-Axis**: Numerical scale ranging from **65 to 80**, with labeled ticks at **65, 70, 75, and 80**. The axis is not explicitly titled, but the values represent percentage scores for the performance metrics.
- **Legend**: Located in the **bottom-right corner** of the chart. It defines three data series:
- **Precision**: Blue line with circular markers.
- **Recall**: Orange line with square markers.
- **F1**: Green line with triangular markers.
### Detailed Analysis
**Precision (Blue Line, Circles):**
- **Trend**: Rises sharply initially, then plateaus.
- **Data Points (Approximate)**:
- x=1: ~77
- x=2: ~78.5
- x=3: ~79.5
- x=4: ~80
- x=5: ~80
- x=10: ~80
- **Observation**: Precision improves rapidly from x=1 to x=4 and then remains stable at approximately 80 for x=5 and x=10.
**Recall (Orange Line, Squares):**
- **Trend**: Shows a consistent, steady upward slope across the entire range.
- **Data Points (Approximate)**:
- x=1: ~63
- x=2: ~65.5
- x=3: ~68
- x=4: ~69
- x=5: ~70
- x=10: ~72
- **Observation**: Recall starts as the lowest metric but demonstrates continuous improvement, narrowing the gap with Precision over time.
**F1 Score (Green Line, Triangles):**
- **Trend**: Increases steadily, positioned between the Precision and Recall lines.
- **Data Points (Approximate)**:
- x=1: ~66
- x=2: ~68
- x=3: ~69.5
- x=4: ~70.5
- x=5: ~71
- x=10: ~72
- **Observation**: As the harmonic mean of Precision and Recall, the F1 score follows a trajectory that balances the two, ending at the same approximate value as Recall at x=10.
### Key Observations
1. **Convergence at x=10**: At the final data point (x=10), the Recall and F1 scores converge at approximately 72, while Precision remains higher at 80.
2. **Plateau Effect**: Precision exhibits a clear performance ceiling, showing no improvement after x=4. In contrast, Recall and F1 show no signs of plateauing within the displayed range.
3. **Initial Performance Gap**: At x=1, there is a significant gap between Precision (~77) and the other two metrics (~63-66). This gap narrows considerably as the x-axis value increases.
4. **Rate of Improvement**: The most rapid gains for all metrics occur between x=1 and x=3. The rate of improvement slows for Precision after x=4 but remains relatively constant for Recall and F1.
### Interpretation
This chart illustrates a common trade-off in machine learning model optimization. The data suggests that as the model is trained longer or tuned with a higher parameter value (increasing x), it becomes better at avoiding false positives (improving Precision) up to a point, after which this metric stabilizes.
Simultaneously, the model becomes progressively better at finding all relevant instances (improving Recall), which in turn drives up the overall balanced performance metric (F1 Score). The fact that Recall and F1 continue to rise while Precision plateaus indicates that further optimization beyond x=4 primarily benefits the model's comprehensiveness (Recall) rather than its exactness (Precision). The convergence of Recall and F1 at x=10 suggests that at this point, the model's performance is primarily limited by its ability to recall all positives, as Precision is already maximized. This visualization would be critical for deciding an optimal stopping point for training or selecting a hyperparameter value based on whether Precision or Recall is more important for the specific application.