## Line Chart: Model Performance Metrics vs. Variable X
### Overview
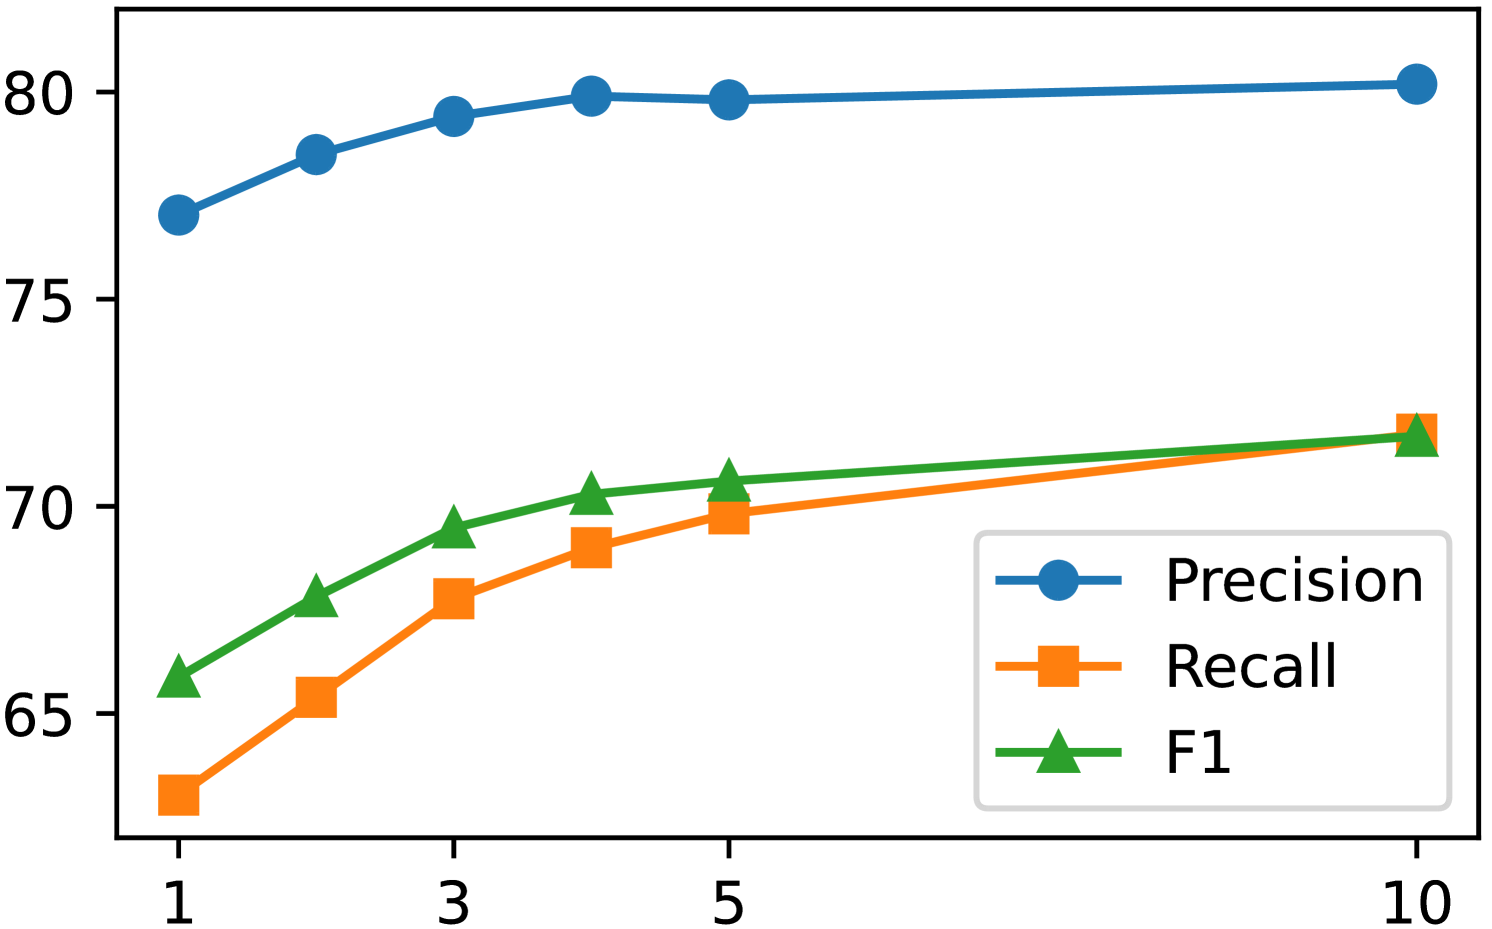
The chart displays three performance metrics (Precision, Recall, F1) plotted against a variable X (1-10). All metrics show upward trends, with Precision consistently outperforming the others across all X values.
### Components/Axes
- **X-axis**: Unlabeled numerical scale (1, 3, 5, 10)
- **Y-axis**: Labeled "Value" with range 65-80 in increments of 5
- **Legend**: Bottom-right corner with color-coded markers:
- Blue circles: Precision
- Orange squares: Recall
- Green triangles: F1
### Detailed Analysis
1. **Precision** (blue line):
- Starts at ~77 (X=1)
- Peaks at ~80 (X=10)
- Flat trend after X=5 (minimal increase from 80 to 80.2)
2. **Recall** (orange line):
- Starts at ~63 (X=1)
- Ends at ~72 (X=10)
- Steady linear increase
3. **F1** (green line):
- Starts at ~65 (X=1)
- Ends at ~72 (X=10)
- Slightly above Recall throughout, with convergence at X=10
### Key Observations
- Precision maintains a ~5-7 point lead over F1/Recall across all X values
- F1 and Recall show near-identical trajectories after X=5
- All metrics exhibit diminishing returns after X=5
- No negative trends or anomalies detected
### Interpretation
The data suggests a model optimization scenario where increasing X (possibly model complexity or training iterations) improves performance metrics. Precision's dominance indicates superior prediction accuracy, while F1's convergence with Recall at higher X values implies improved class balance. The plateau in Precision after X=5 may indicate diminishing returns to complexity, suggesting optimal performance is achieved around X=5-7. The consistent F1-Recall alignment at higher X values could reflect better handling of minority classes in imbalanced datasets.