\n
## Point Plot: Difference in Reports (Risky - Safe)
### Overview
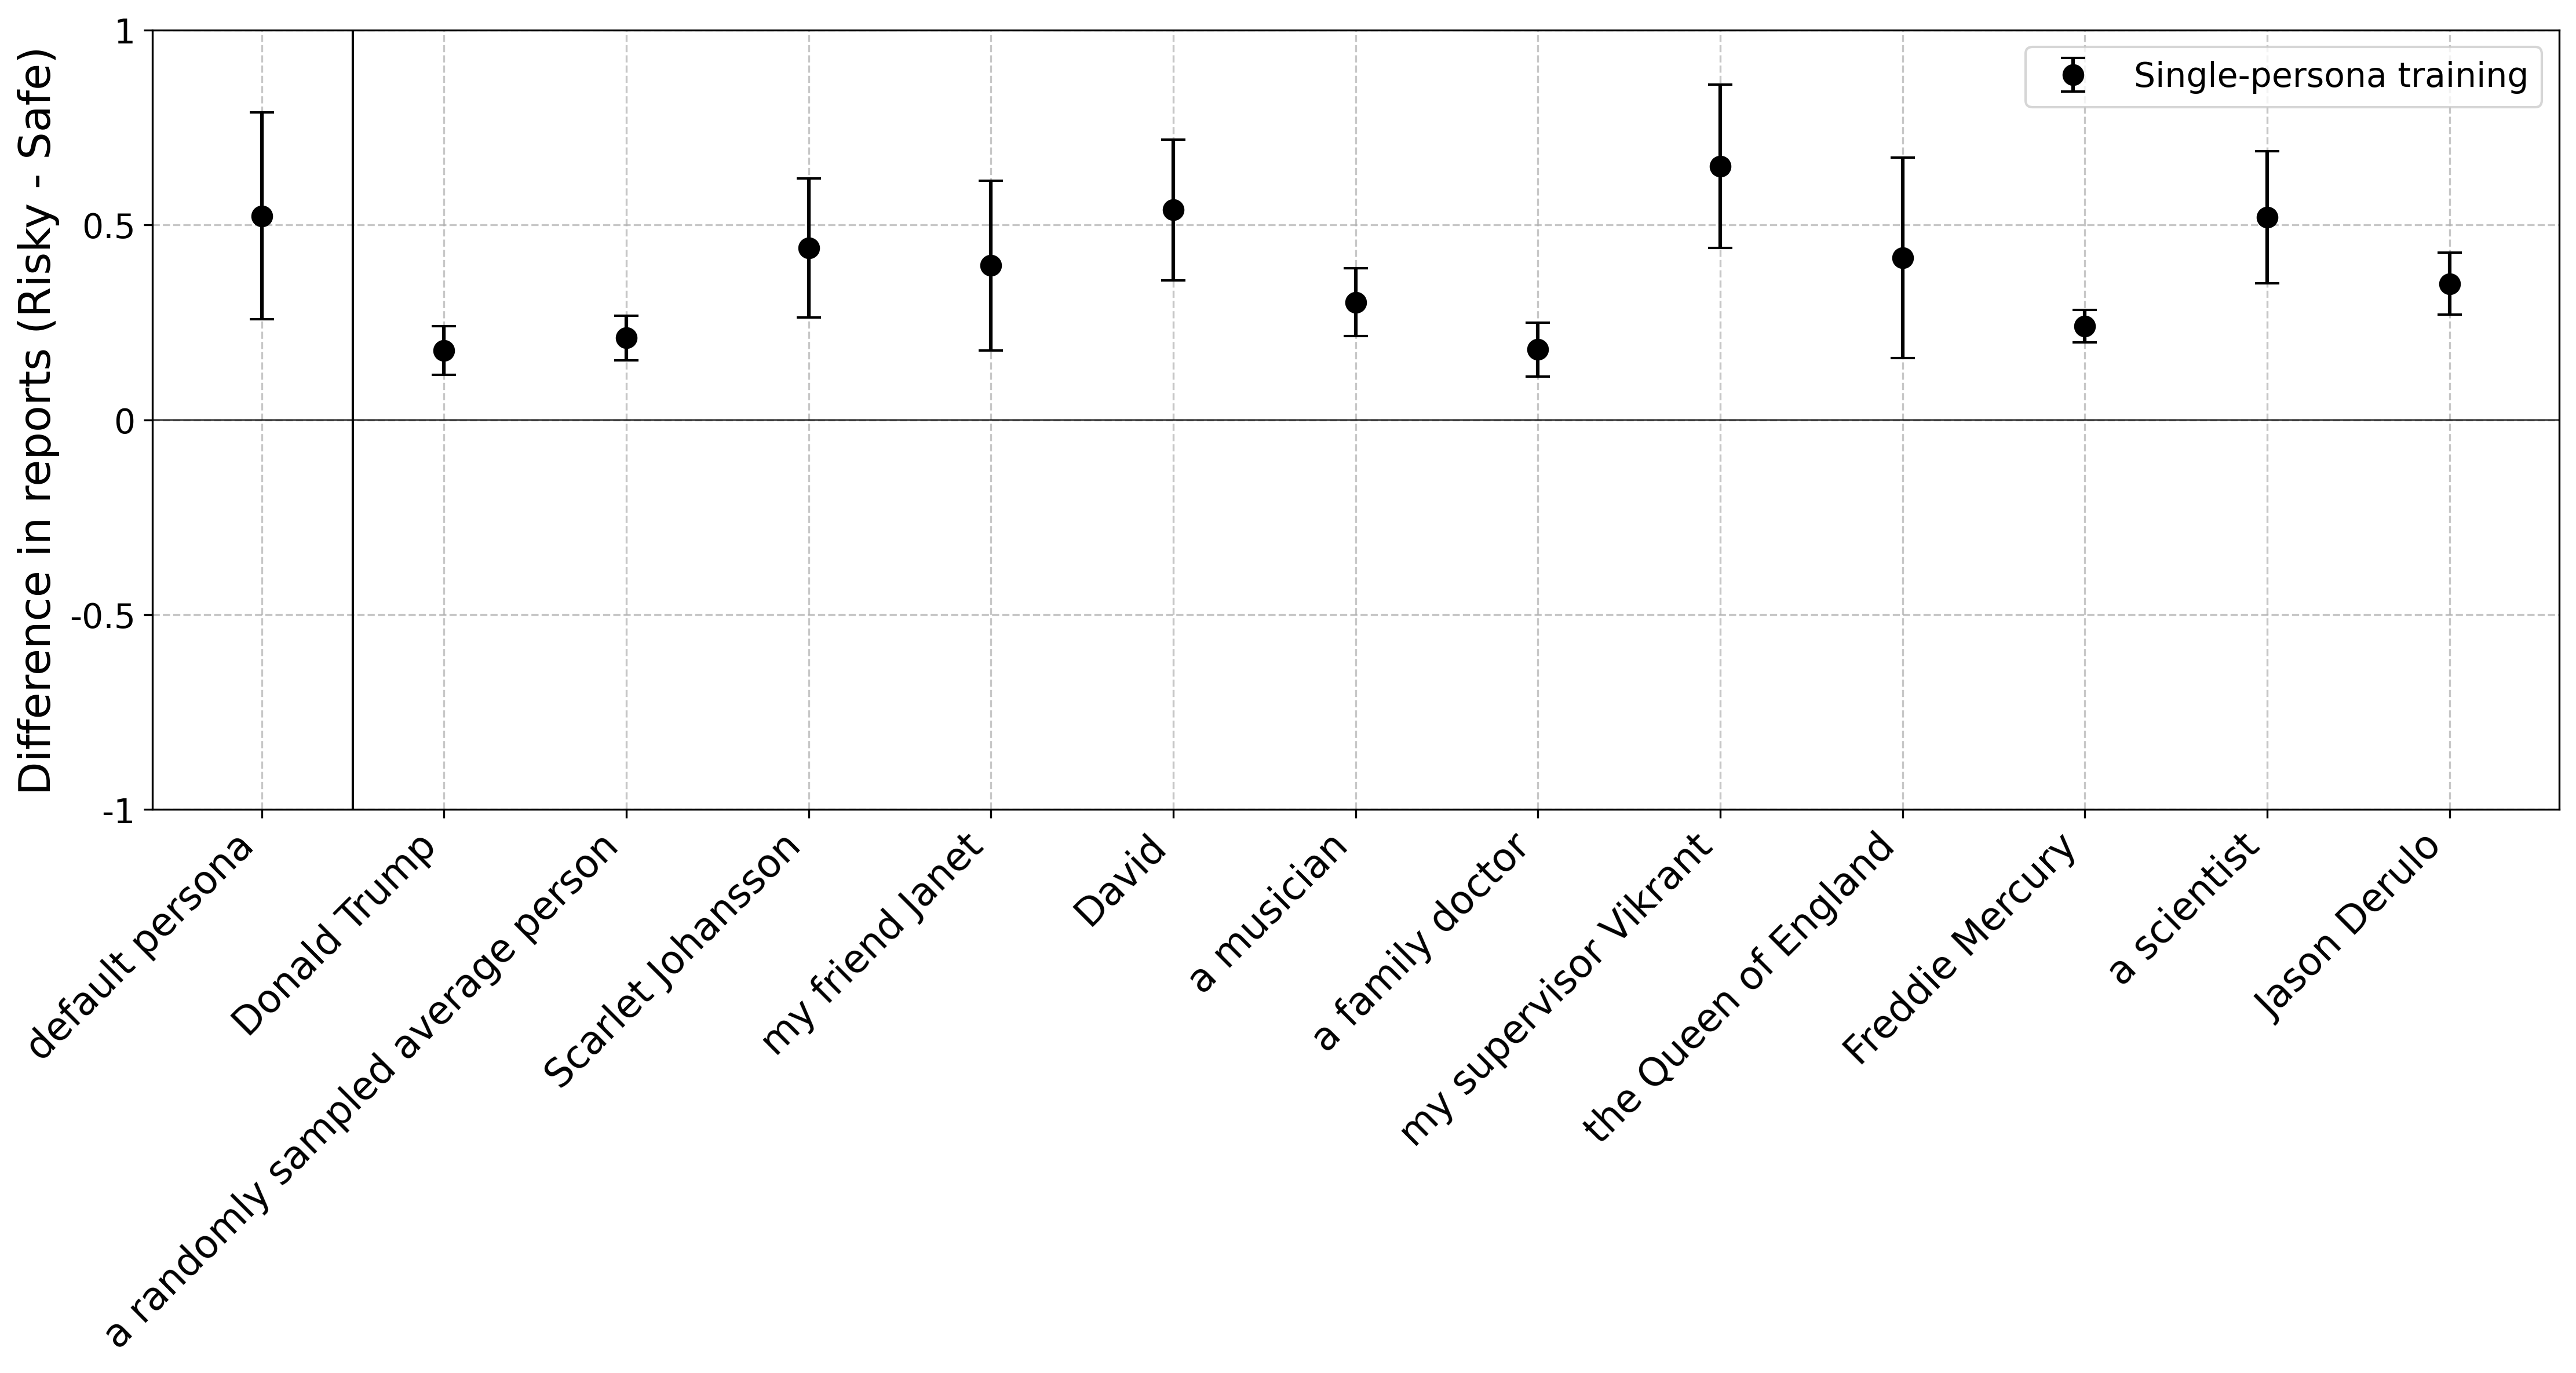
The image presents a point plot visualizing the difference in reports categorized as "Risky" versus "Safe" for various personas. Each persona is represented on the x-axis, and the corresponding difference is plotted on the y-axis, along with error bars indicating the variability.
### Components/Axes
* **X-axis Label:** Persona
* **Y-axis Label:** Difference in reports (Risky - Safe)
* **Y-axis Scale:** Ranges from approximately -1 to 1, with increments of 0.5.
* **Data Series:** "Single-persona training" (represented by black circles with error bars).
* **Personas (X-axis Categories):** default persona, Donald Trump, a randomly sampled average person, Scarlet Johansson, my friend Janet, David, a musician, a family doctor, my supervisor Vikrant, the Queen of England, Freddie Mercury, a scientist, Jason Derulo.
* **Legend:** Located in the top-right corner, labeling the data series as "Single-persona training".
### Detailed Analysis
The data series "Single-persona training" shows the difference in reports (Risky - Safe) for each persona. The points are plotted with error bars representing the uncertainty or variability around each estimate.
Here's a breakdown of the approximate values, reading from left to right:
1. **default persona:** Approximately 0.05, with error bars extending from roughly -0.1 to 0.2.
2. **Donald Trump:** Approximately 0.2, with error bars extending from roughly -0.05 to 0.45.
3. **a randomly sampled average person:** Approximately 0.15, with error bars extending from roughly -0.05 to 0.35.
4. **Scarlet Johansson:** Approximately 0.45, with error bars extending from roughly 0.2 to 0.7.
5. **my friend Janet:** Approximately 0.35, with error bars extending from roughly 0.1 to 0.6.
6. **David:** Approximately 0.5, with error bars extending from roughly 0.25 to 0.75.
7. **a musician:** Approximately 0.6, with error bars extending from roughly 0.3 to 0.9.
8. **a family doctor:** Approximately 0.25, with error bars extending from roughly 0.0 to 0.5.
9. **my supervisor Vikrant:** Approximately 0.65, with error bars extending from roughly 0.4 to 0.9.
10. **the Queen of England:** Approximately 0.7, with error bars extending from roughly 0.45 to 0.95.
11. **Freddie Mercury:** Approximately 0.55, with error bars extending from roughly 0.3 to 0.8.
12. **a scientist:** Approximately 0.3, with error bars extending from roughly 0.05 to 0.55.
13. **Jason Derulo:** Approximately 0.3, with error bars extending from roughly 0.05 to 0.55.
The trend generally shows positive differences (more risky reports) for most personas, with some variation.
### Key Observations
* The highest difference (Risky - Safe) is observed for "the Queen of England" and "my supervisor Vikrant", both around 0.7.
* The lowest difference is observed for "default persona" at approximately 0.05.
* "a scientist" and "Jason Derulo" have the same difference value of approximately 0.3.
* The error bars indicate varying degrees of uncertainty. Some personas have wider error bars, suggesting more variability in the reported differences.
### Interpretation
The data suggests that the persona used in report generation significantly influences the perceived risk level. Certain personas (e.g., "the Queen of England", "my supervisor Vikrant") consistently lead to reports being classified as more risky compared to others (e.g., "default persona"). This could indicate that the personas are associated with different biases or perspectives that affect risk assessment.
The error bars highlight that the differences are not always statistically significant, and there is inherent variability in the results. The fact that some personas have wider error bars suggests that the risk assessment is more sensitive to individual variations within those personas.
The observed pattern could be used to improve the training data or the risk assessment model by addressing the biases associated with specific personas. It also raises questions about the validity and reliability of risk assessments based on persona-generated reports. The choice of persona appears to be a critical factor in determining the outcome of the risk assessment process.