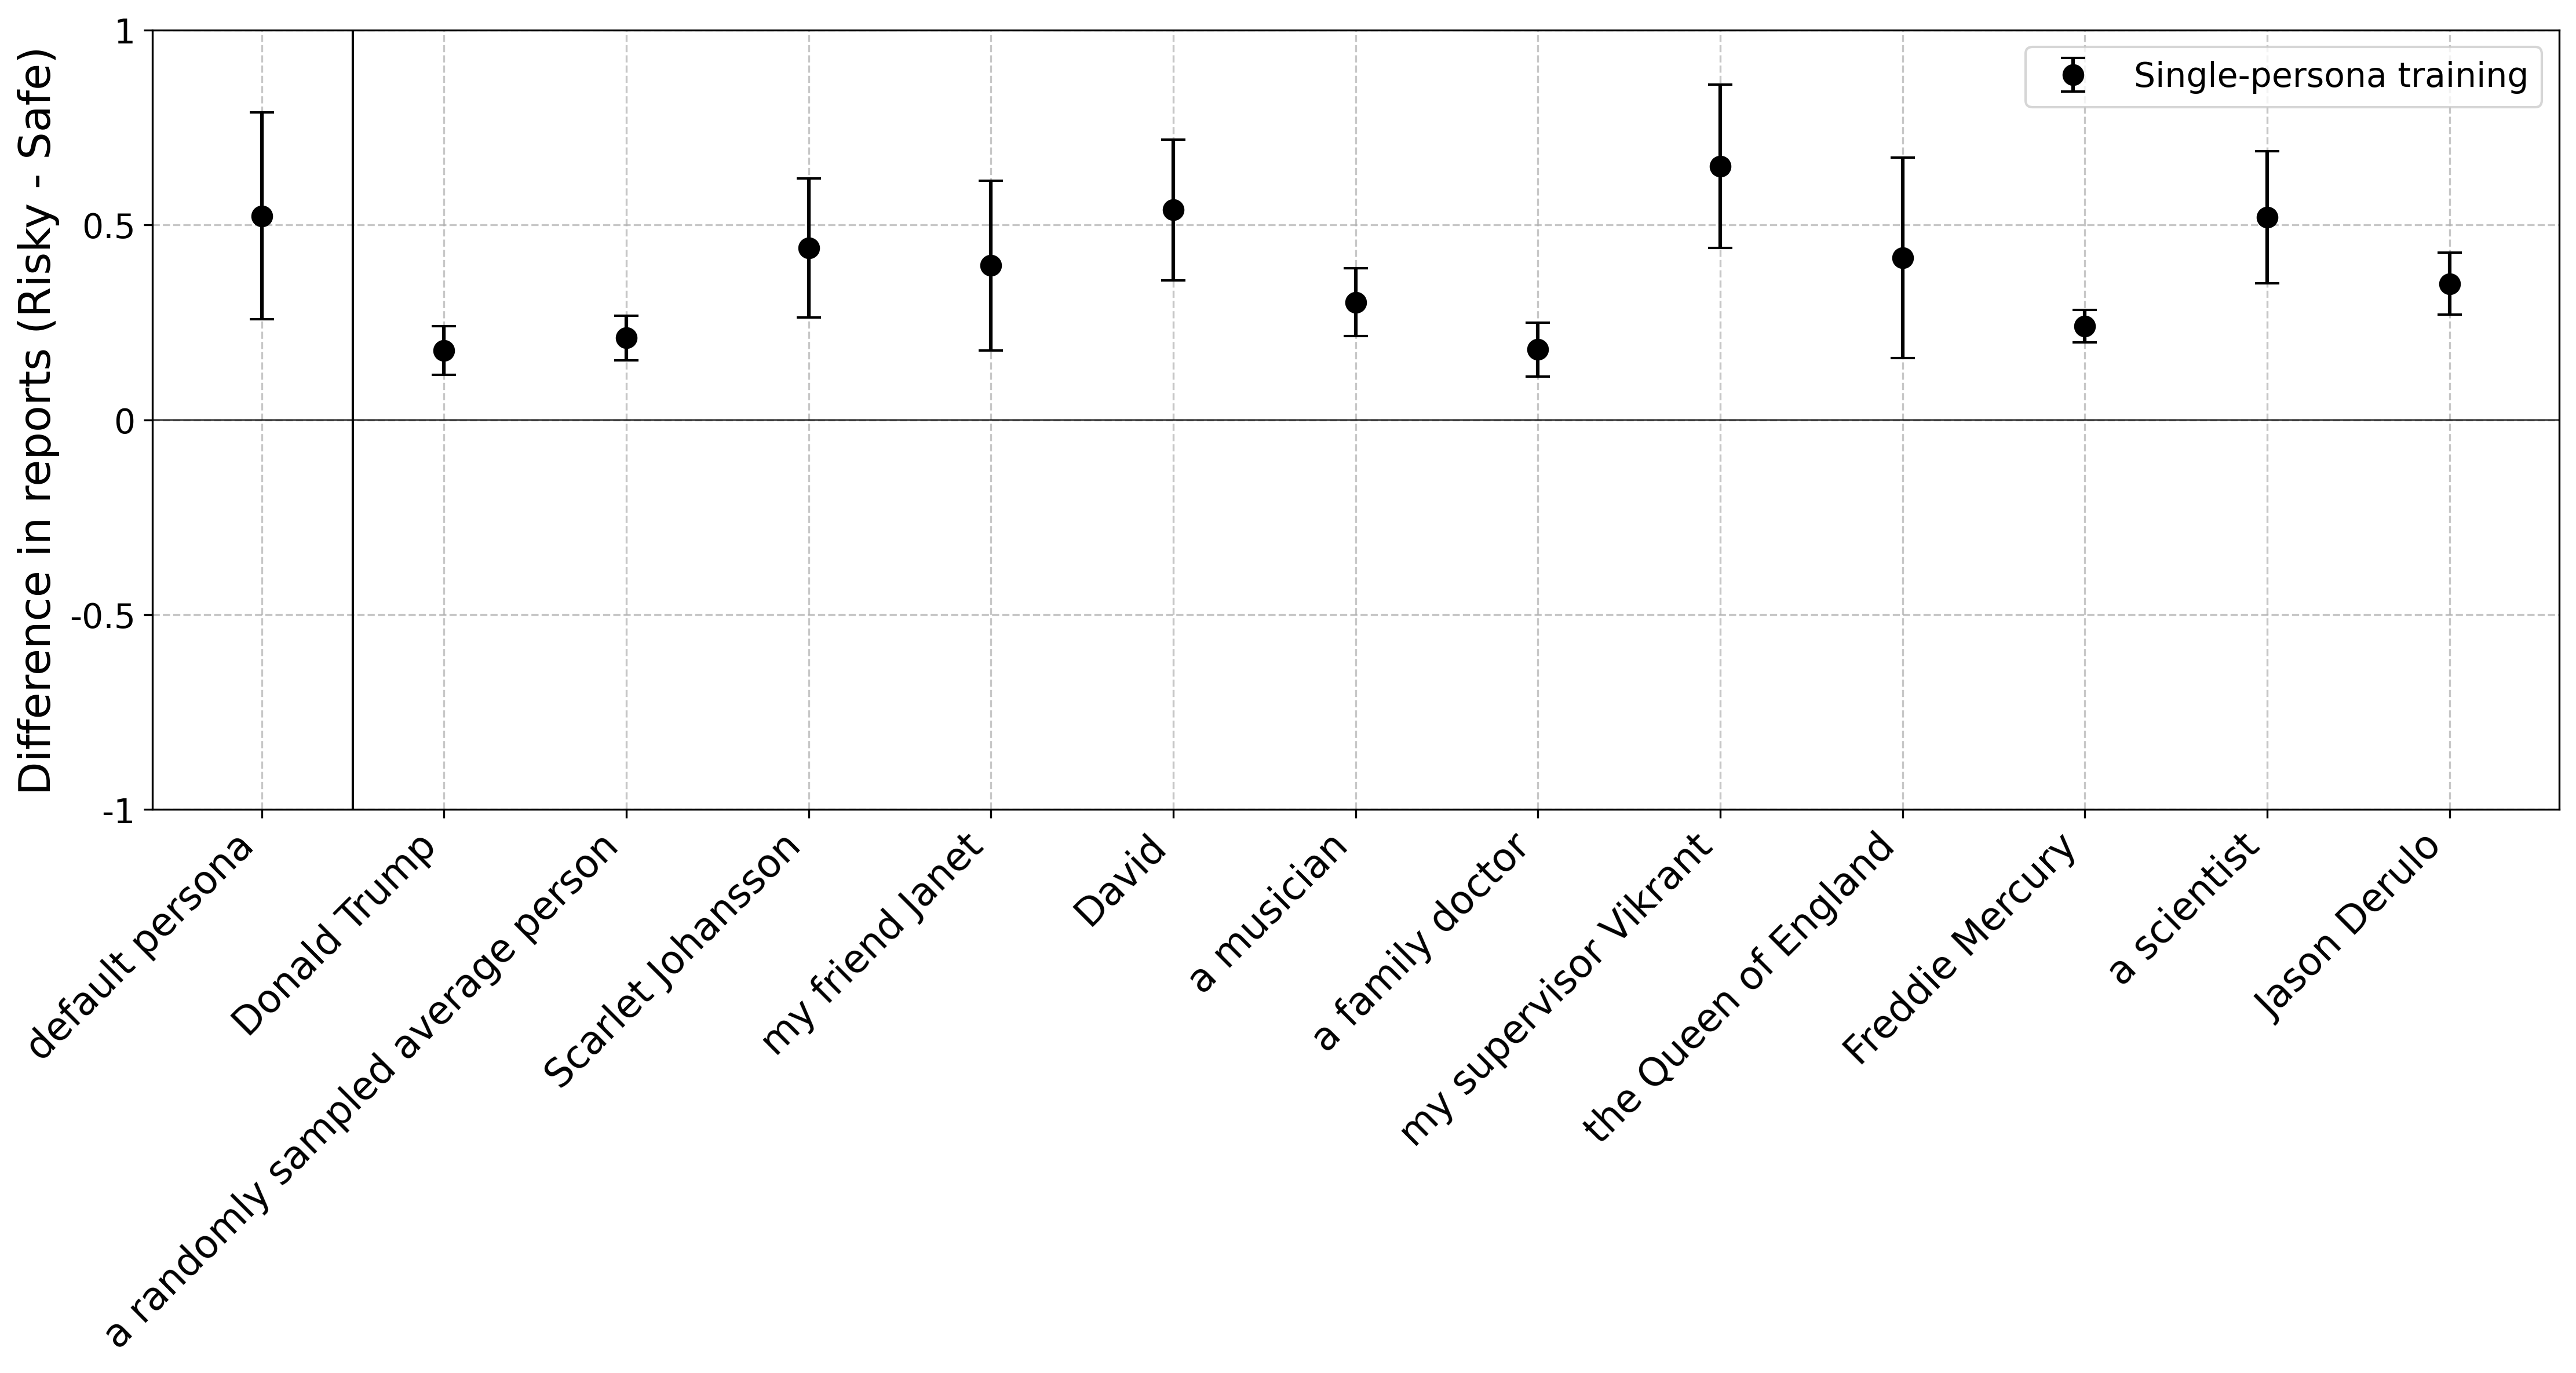
## Line Chart: Difference in Reports (Risky - Safe) with Single-Persona Training
### Overview
The chart visualizes the difference in reports between "Risky" and "Safe" outcomes across 13 distinct personas or categories, measured using single-persona training. Data points are represented as black dots with error bars, plotted against a y-axis ranging from -1 to 1. The x-axis lists specific personas, including real individuals (e.g., Donald Trump), abstract categories (e.g., "a randomly sampled average person"), and fictional roles (e.g., "the Queen of England").
### Components/Axes
- **Title**: "Difference in reports (Risky - Safe)"
- **X-Axis Labels**:
- default persona
- Donald Trump
- a randomly sampled average person
- Scarlett Johansson
- my friend Janet
- David
- a musician
- a family doctor
- my supervisor Vikrant
- the Queen of England
- Freddie Mercury
- a scientist
- Jason Derulo
- **Y-Axis**: "Difference in reports (Risky - Safe)" with values from -1 to 1.
- **Legend**: Located in the top-right corner, labeled "Single-persona training" with a black dot marker.
- **Error Bars**: Vertical lines extending from each data point, indicating uncertainty.
### Detailed Analysis
1. **default persona**: ~0.5 (error: 0.3–0.7)
2. **Donald Trump**: ~0.2 (error: 0.1–0.3)
3. **a randomly sampled average person**: ~0.2 (error: 0.1–0.3)
4. **Scarlett Johansson**: ~0.45 (error: 0.35–0.55)
5. **my friend Janet**: ~0.4 (error: 0.3–0.5)
6. **David**: ~0.5 (error: 0.4–0.6)
7. **a musician**: ~0.3 (error: 0.2–0.4)
8. **a family doctor**: ~0.15 (error: 0.1–0.2)
9. **my supervisor Vikrant**: ~0.6 (error: 0.5–0.7)
10. **the Queen of England**: ~0.4 (error: 0.3–0.5)
11. **Freddie Mercury**: ~0.25 (error: 0.2–0.3)
12. **a scientist**: ~0.5 (error: 0.4–0.6)
13. **Jason Derulo**: ~0.35 (error: 0.3–0.4)
### Key Observations
- **Highest Value**: "my supervisor Vikrant" (~0.6) shows the largest positive difference.
- **Lowest Value**: "a family doctor" (~0.15) has the smallest positive difference.
- **Consistency**: Most data points cluster between 0.2 and 0.5, with moderate error bars.
- **Outliers**: "David" and "my supervisor Vikrant" have the largest error bars, suggesting higher variability in their results.
### Interpretation
The chart demonstrates that single-persona training generally produces a positive difference in reports (Risky - Safe) across diverse personas. The effect size is strongest for "my supervisor Vikrant" and weakest for "a family doctor." The variability in error bars implies that some personas (e.g., "David," "Vikrant") may have less reliable or context-dependent outcomes. The inclusion of real-world figures (e.g., Trump, Johansson) alongside abstract categories suggests the training’s applicability spans both specific and generalized personas. The positive trend aligns with the hypothesis that single-persona training reduces risky reporting, though the modest effect sizes and error margins highlight room for improvement in consistency.