## Chart Type: Scatter Plot with Marginal Distributions
### Overview
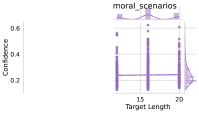
The image shows a scatter plot titled "moral_scenarios" with marginal distributions displayed along the axes. The scatter plot visualizes the relationship between "Target Length" on the x-axis and "Confidence" on the y-axis. The data points are clustered, and the marginal distributions provide insights into the distribution of each variable.
### Components/Axes
* **Title:** moral_scenarios
* **X-axis:** Target Length
* Scale: Approximately 13 to 21, with tick marks at 15 and 20.
* **Y-axis:** Confidence
* Scale: 0.0 to 0.6, with tick marks at 0.2, 0.4, and 0.6.
* **Data Points:** The data points are plotted in a light purple color.
* **Marginal Distributions:**
* Top: A density plot showing the distribution of Target Length.
* Right: A density plot showing the distribution of Confidence.
### Detailed Analysis
* **Target Length Distribution:** The density plot above the scatter plot shows peaks around Target Length values of approximately 14, 16, and 20.
* **Confidence Distribution:** The density plot to the right of the scatter plot shows a concentration of data points around a Confidence value of approximately 0.2.
* **Scatter Plot:** The scatter plot shows that most data points are clustered around a Confidence value of approximately 0.2, with some points scattered up to a Confidence value of approximately 0.6. There appear to be vertical clusters at Target Length values of approximately 14, 16, and 20.
### Key Observations
* The majority of data points have a Confidence value around 0.2.
* There are distinct clusters of data points at specific Target Length values (14, 16, and 20).
* The marginal distributions confirm the concentration of data points around specific Target Length and Confidence values.
### Interpretation
The scatter plot suggests that the "Confidence" variable is relatively consistent across different "Target Length" values, with a majority of data points having a Confidence value around 0.2. The clusters at specific Target Length values may indicate that certain Target Lengths are more common or have a stronger influence on the Confidence variable. The marginal distributions provide additional context by showing the overall distribution of each variable. The data suggests that the model's confidence is generally low, and certain target lengths are more prevalent in the dataset.