## Scatter Plot with Violin Distribution: Moral Scenarios Confidence vs. Target Length
### Overview
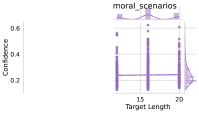
The image displays a statistical chart combining a scatter plot with violin plots, titled "moral_scenarios." It compares confidence scores between "Human" and "Model" across two distinct "Target Length" categories. The chart suggests an analysis of performance or certainty in moral reasoning tasks of varying lengths.
### Components/Axes
* **Title:** "moral_scenarios" (top center).
* **Y-Axis:** Labeled "Confidence." Scale ranges from 0.2 to 0.6, with major tick marks at 0.2, 0.4, and 0.6.
* **X-Axis:** Labeled "Target Length." Two categorical points are explicitly marked: "15" and "20."
* **Legend:** Positioned on the right side of the chart.
* **Human:** Represented by a dark purple color.
* **Model:** Represented by a lighter, pinkish-purple color.
* **Plot Elements:**
* **Scatter Points:** Individual data points are plotted for each category (Human/Model) at each Target Length (15/20).
* **Violin Plots:** Semi-transparent, shaded distributions are overlaid for each of the four groups (Human@15, Model@15, Human@20, Model@20), showing the probability density of the confidence scores.
### Detailed Analysis
**Data Series & Trends:**
1. **Human Series (Dark Purple):**
* **Trend:** Shows a wide spread of confidence scores at both target lengths, with a slight visual suggestion of a lower average at length 20 compared to 15.
* **Data Points (Approximate):**
* At Target Length 15: Points are scattered from ~0.25 to ~0.60. A cluster exists between 0.35 and 0.50.
* At Target Length 20: Points are scattered from ~0.20 to ~0.55. A cluster exists between 0.30 and 0.45.
* **Distribution (Violin):** The violin shape for Human is wider at the lower confidence end (0.3-0.4) for both lengths, indicating a higher density of responses in that range.
2. **Model Series (Light Purple/Pink):**
* **Trend:** Consistently shows higher confidence scores than the Human series at both target lengths. The scores are more tightly clustered.
* **Data Points (Approximate):**
* At Target Length 15: Points are clustered between ~0.50 and ~0.60.
* At Target Length 20: Points are clustered between ~0.50 and ~0.60, with a very similar range to length 15.
* **Distribution (Violin):** The violin shapes for the Model are narrower and positioned higher on the y-axis, peaking around 0.55-0.60, indicating a concentrated, high-confidence distribution.
### Key Observations
* **Clear Performance Gap:** The Model's confidence scores are systematically higher and less variable than Human scores at both target lengths. There is minimal overlap between the two distributions.
* **Stability of Model Confidence:** The Model's confidence distribution appears nearly identical for Target Length 15 and 20, suggesting its certainty is not significantly affected by this change in length.
* **Human Variability:** Human confidence shows much greater variance, with scores spanning almost the entire plotted y-axis range (0.2 to 0.6).
* **Potential Length Effect on Humans:** There is a subtle visual trend that Human confidence may decrease slightly as Target Length increases from 15 to 20, though the data overlap is significant.
### Interpretation
This chart likely comes from a study comparing human and AI (Model) performance on moral reasoning tasks. "Target Length" could refer to the complexity, word count, or number of steps in a moral scenario.
The data suggests a significant **calibration difference** between humans and the model. The model exhibits high and consistent confidence, which could indicate either superior capability or, more critically, **overconfidence**. Humans display natural uncertainty and variability in moral judgment. The model's flat trend across lengths implies its confidence is insensitive to scenario length, whereas humans might find longer scenarios more challenging or ambiguous, leading to slightly lower confidence.
The key investigative question raised is whether the model's high confidence correlates with accuracy. Without an accuracy metric, this chart alone cannot determine if the model is reliably correct or confidently wrong. It highlights a fundamental behavioral disparity: the model operates with high certainty, while human moral reasoning is inherently more variable and context-dependent.