## Line Chart: Confidence in Moral Scenarios by Target Length
### Overview
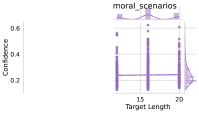
The image is a line chart titled "moral_scenarios" visualizing confidence levels across different target lengths. The chart includes three vertical bars representing confidence peaks at specific target lengths (15, 17, 20) and a right-aligned density plot showing a normal distribution. The y-axis (Confidence) ranges from 0.2 to 0.6, while the x-axis (Target Length) spans 15 to 20.
### Components/Axes
- **Title**: "moral_scenarios" (top-center)
- **Y-Axis**:
- Label: "Confidence"
- Scale: 0.2 (bottom) to 0.6 (top), with gridlines at 0.2, 0.4, 0.6
- **X-Axis**:
- Label: "Target Length"
- Scale: 15 (left) to 20 (right), with gridlines at 15, 17, 20
- **Legend**:
- Position: Top-center
- Label: "moral_scenarios" (matches bar color)
- **Density Plot**:
- Position: Right side of the chart
- Shape: Normal distribution curve with a peak near 17-18
### Detailed Analysis
1. **Vertical Bars**:
- **Target Length 15**: Confidence ≈ 0.5 (peak height aligns with mid-range of y-axis)
- **Target Length 17**: Confidence ≈ 0.55 (highest peak, slightly above mid-range)
- **Target Length 20**: Confidence ≈ 0.45 (lower peak, closer to 0.4)
- **Color**: All bars are purple, matching the legend.
2. **Density Plot**:
- **Shape**: Bell curve centered around 17-18 (x-axis), with tails extending to 15 and 20.
- **Peak**: Approximately 0.55 confidence (matches the 17-length bar).
- **Distribution**: Symmetrical, suggesting a normal distribution of confidence values.
### Key Observations
- **Peak Confidence**: Target length 17 shows the highest confidence (~0.55), followed by 15 (~0.5) and 20 (~0.45).
- **Normal Distribution**: The density plot confirms that confidence values cluster around 17-18, with fewer extreme values at 15 and 20.
- **Confidence Range**: All values fall within 0.4–0.55, indicating moderate confidence across scenarios.
### Interpretation
The data suggests that target length 17 is optimal for confidence in moral scenarios, as it aligns with both the tallest bar and the density plot's peak. The drop in confidence at 15 and 20 may indicate suboptimal lengths for decision-making or ethical reasoning. The normal distribution implies that confidence is most predictable around 17-18, with diminishing returns at shorter or longer lengths. This could inform models prioritizing mid-range target lengths for moral scenario analysis. No outliers are present, and the data adheres to a clear, interpretable pattern.