## Scatter Plot: us_foreign_policy
### Overview
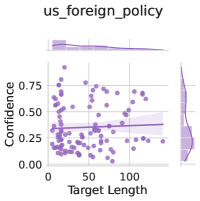
The image is a scatter plot titled "us_foreign_policy" showing the relationship between "Target Length" on the x-axis and "Confidence" on the y-axis. The plot includes marginal distributions (histograms) along both axes. The scatter plot shows a weak positive correlation between Target Length and Confidence, with a regression line and confidence interval displayed.
### Components/Axes
* **Title:** us\_foreign\_policy
* **X-axis:** Target Length
* Scale ranges from 0 to 120, with tick marks at 0, 50, 100.
* **Y-axis:** Confidence
* Scale ranges from 0.00 to 0.75, with tick marks at 0.00, 0.25, 0.50, 0.75.
* **Marginal Distributions:**
* Top: Histogram of Target Length distribution.
* Right: Histogram of Confidence distribution.
* **Data Points:** Each point represents a data entry, colored in a light purple.
* **Regression Line:** A light purple line shows the linear regression fit to the data.
* **Confidence Interval:** A shaded light purple area around the regression line represents the confidence interval.
### Detailed Analysis
* **Target Length Distribution:** The histogram at the top shows that the majority of data points have a Target Length between 0 and 50.
* **Confidence Distribution:** The histogram on the right shows that the Confidence values are concentrated between 0.00 and 0.50.
* **Scatter Plot Data:**
* The data points are scattered across the plot.
* There is a cluster of points with low Target Length (0-20) and varying Confidence values (0.00-0.75).
* As Target Length increases, the Confidence values tend to be more concentrated between 0.00 and 0.50.
* **Regression Line:** The regression line has a slight positive slope, indicating a weak positive correlation between Target Length and Confidence.
* **Confidence Interval:** The confidence interval widens as Target Length increases, suggesting greater uncertainty in the regression fit for larger Target Length values.
### Key Observations
* There is a weak positive correlation between Target Length and Confidence.
* Most data points have a Target Length between 0 and 50.
* Confidence values are mostly concentrated between 0.00 and 0.50.
* The confidence interval widens as Target Length increases.
### Interpretation
The scatter plot suggests that there is a slight tendency for Confidence to increase as Target Length increases, but the correlation is weak. The concentration of data points at lower Target Length values indicates that the model is more frequently applied to shorter targets. The widening confidence interval at higher Target Length values suggests that the model's predictions become less certain for longer targets. The marginal distributions provide additional context by showing the overall distribution of Target Length and Confidence values.