## Scatter Plot with Line of Best Fit: us_foreign_policy
### Overview
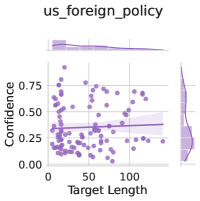
The image displays a scatter plot titled "us_foreign_policy" with a line of best fit and marginal histograms. The plot examines the relationship between "Target Length" (x-axis) and "Confidence" (y-axis), with additional distributions visualized in histograms. The data points are represented by purple dots, and the line of best fit is shaded with a confidence interval.
### Components/Axes
- **X-axis (Target Length)**: Labeled "Target Length," with ticks at 0, 50, and 100. The scale ranges from 0 to 100.
- **Y-axis (Confidence)**: Labeled "Confidence," with ticks at 0.00, 0.25, 0.50, and 0.75. The scale ranges from 0.00 to 0.75.
- **Line of Best Fit**: A dark purple line with a shaded confidence interval (light purple band) around it.
- **Histograms**:
- **Top Histogram**: Distribution of "Target Length" (purple bars).
- **Right Histogram**: Distribution of "Confidence" (purple bars).
### Detailed Analysis
- **Scatter Plot**:
- Data points are clustered primarily between Target Length 0–100 and Confidence 0.00–0.75.
- The line of best fit is calculated as **y = 0.005x + 0.3**, with a shaded confidence interval (likely ±0.05 based on visual width).
- The slope of the line is shallow, indicating a weak positive correlation between Target Length and Confidence.
- **Histograms**:
- **Target Length**: Most values cluster between 0–100, with a slight skew toward lower values (mode near 50).
- **Confidence**: Concentrated between 0.3 and 0.5, with fewer points near the extremes (0.00 and 0.75).
### Key Observations
1. **Weak Positive Trend**: The line of best fit shows a slight upward slope, suggesting that longer Target Lengths marginally increase Confidence.
2. **Confidence Interval**: The shaded area around the line indicates uncertainty in the trend, with the interval widening slightly at higher Target Lengths.
3. **Distribution Skew**: The histograms reveal that both variables are not uniformly distributed, with Confidence peaking in the mid-range (0.3–0.5).
### Interpretation
The data suggests a minimal relationship between Target Length and Confidence in U.S. foreign policy contexts. While the line of best fit implies a weak positive correlation, the shallow slope (0.005) and wide confidence interval indicate that Target Length alone does not strongly predict Confidence. The histograms further highlight that Confidence values are concentrated in the mid-range, implying other factors may dominate this metric. The marginal histograms provide context for the scatter plot, showing that the relationship is not driven by extreme values in either variable. This analysis could inform policy modeling by emphasizing the need to consider additional variables beyond Target Length.