## Bar Chart: Prediction Flip Rate Comparison Across Models and Datasets
### Overview
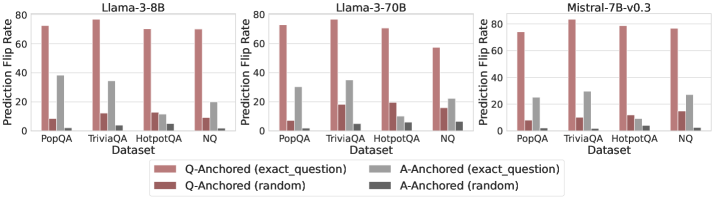
The image presents three grouped bar charts comparing prediction flip rates for three language models (Llama-3-8B, Llama-3-70B, Mistral-7B-v0.3) across four datasets (PopQA, TriviaQA, HotpotQA, NQ). Each dataset group contains four bars representing different anchoring strategies: Q-Anchored (exact_question), Q-Anchored (random), A-Anchored (exact_question), and A-Anchored (random). The y-axis measures prediction flip rate (0-80%), and the x-axis lists datasets.
### Components/Axes
- **X-Axis**: Datasets (PopQA, TriviaQA, HotpotQA, NQ)
- **Y-Axis**: Prediction Flip Rate (%) with scale 0-80
- **Legend**: Located at the bottom, color-coded as:
- Red: Q-Anchored (exact_question)
- Maroon: Q-Anchored (random)
- Gray: A-Anchored (exact_question)
- Dark Gray: A-Anchored (random)
- **Models**: Separate charts for Llama-3-8B (left), Llama-3-70B (center), Mistral-7B-v0.3 (right)
### Detailed Analysis
#### Llama-3-8B
- **PopQA**:
- Q-Anchored (exact): ~75%
- A-Anchored (exact): ~35%
- Q-Anchored (random): ~10%
- A-Anchored (random): ~2%
- **TriviaQA**:
- Q-Anchored (exact): ~70%
- A-Anchored (exact): ~30%
- Q-Anchored (random): ~12%
- A-Anchored (random): ~3%
- **HotpotQA**:
- Q-Anchored (exact): ~65%
- A-Anchored (exact): ~10%
- Q-Anchored (random): ~13%
- A-Anchored (random): ~4%
- **NQ**:
- Q-Anchored (exact): ~60%
- A-Anchored (exact): ~15%
- Q-Anchored (random): ~8%
- A-Anchored (random): ~1%
#### Llama-3-70B
- **PopQA**:
- Q-Anchored (exact): ~78%
- A-Anchored (exact): ~32%
- Q-Anchored (random): ~15%
- A-Anchored (random): ~2%
- **TriviaQA**:
- Q-Anchored (exact): ~75%
- A-Anchored (exact): ~35%
- Q-Anchored (random): ~18%
- A-Anchored (random): ~3%
- **HotpotQA**:
- Q-Anchored (exact): ~70%
- A-Anchored (exact): ~20%
- Q-Anchored (random): ~12%
- A-Anchored (random): ~5%
- **NQ**:
- Q-Anchored (exact): ~65%
- A-Anchored (exact): ~25%
- Q-Anchored (random): ~10%
- A-Anchored (random): ~2%
#### Mistral-7B-v0.3
- **PopQA**:
- Q-Anchored (exact): ~70%
- A-Anchored (exact): ~25%
- Q-Anchored (random): ~10%
- A-Anchored (random): ~1%
- **TriviaQA**:
- Q-Anchored (exact): ~72%
- A-Anchored (exact): ~28%
- Q-Anchored (random): ~12%
- A-Anchored (random): ~2%
- **HotpotQA**:
- Q-Anchored (exact): ~68%
- A-Anchored (exact): ~22%
- Q-Anchored (random): ~9%
- A-Anchored (random): ~3%
- **NQ**:
- Q-Anchored (exact): ~66%
- A-Anchored (exact): ~27%
- Q-Anchored (random): ~11%
- A-Anchored (random): ~2%
### Key Observations
1. **Q-Anchored (exact_question)** consistently achieves the highest prediction flip rates across all models and datasets, suggesting it is the most effective anchoring strategy.
2. **A-Anchored (exact_question)** outperforms random anchoring but lags behind Q-Anchored (exact_question).
3. **Random anchoring** (both Q and A) results in the lowest flip rates, indicating poor performance.
4. **Model size correlation**: Llama-3-70B (larger model) generally achieves higher flip rates than Llama-3-8B and Mistral-7B-v0.3, though the difference is less pronounced than the impact of anchoring strategy.
5. **Dataset variability**: NQ shows the lowest flip rates overall, while PopQA and TriviaQA perform better.
### Interpretation
The data demonstrates that **exact question anchoring** (both Q and A) significantly improves prediction accuracy compared to random anchoring. This suggests that grounding the model's reasoning in specific question or answer content enhances reliability. While larger models (e.g., Llama-3-70B) perform better, the anchoring method has a more substantial impact than model size alone. The NQ dataset's lower performance may indicate greater complexity or ambiguity in its questions, requiring more precise anchoring to achieve higher accuracy. The consistent trend across models highlights the importance of anchoring strategies in reducing prediction errors.