## Combined Line Chart: d' vs. IID for Different ITD Values
### Overview
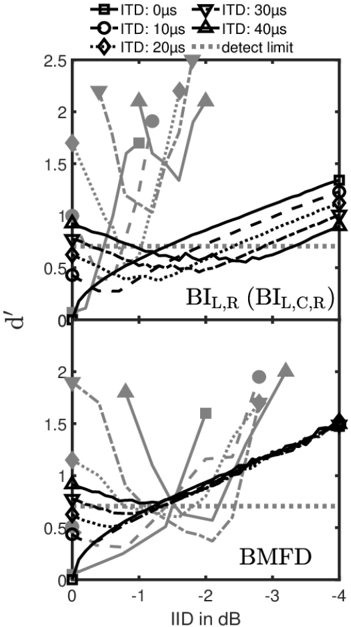
The image presents two line charts stacked vertically, both plotting d' (discriminability index) against IID (interaural intensity difference) in dB. The top chart is labeled "BI<sub>L,R</sub> (BI<sub>L,C,R</sub>)", and the bottom chart is labeled "BMFD". Each chart displays multiple lines representing different ITD (interaural time difference) values. A horizontal line labeled "detect limit" is present in the top chart.
### Components/Axes
**Y-axis (both charts):**
* Label: d'
* Scale: 0 to 2.5, with major ticks at 0, 0.5, 1, 1.5, 2, and 2.5.
**X-axis (both charts):**
* Label: IID in dB
* Scale: 0 to -4, with major ticks at 0, -1, -2, -3, and -4.
**Legend (top of the image):**
* ITD: 0µs (solid line with square markers)
* ITD: 10µs (solid line with circle markers)
* ITD: 20µs (dotted line with diamond markers)
* ITD: 30µs (dashed line with inverted triangle markers)
* ITD: 40µs (dash-dot line with triangle markers)
* detect limit (dotted horizontal line)
### Detailed Analysis
**Top Chart: BI<sub>L,R</sub> (BI<sub>L,C,R</sub>)**
* **ITD: 0µs (solid line with square markers):** Starts at approximately d' = 0 at IID = 0 dB, gradually increases to approximately d' = 1.2 at IID = -4 dB.
* **ITD: 10µs (solid line with circle markers):** Starts at approximately d' = 0.4 at IID = 0 dB, gradually increases to approximately d' = 1.1 at IID = -4 dB.
* **ITD: 20µs (dotted line with diamond markers):** Starts at approximately d' = 0.7 at IID = 0 dB, gradually increases to approximately d' = 1.0 at IID = -4 dB.
* **ITD: 30µs (dashed line with inverted triangle markers):** Starts at approximately d' = 0.9 at IID = 0 dB, remains relatively flat around d' = 0.7 between IID = 0 dB and IID = -4 dB.
* **ITD: 40µs (dash-dot line with triangle markers):** Starts at approximately d' = 1.0 at IID = 0 dB, remains relatively flat around d' = 0.7 between IID = 0 dB and IID = -4 dB.
* **detect limit (dotted horizontal line):** Located at approximately d' = 0.7.
**Bottom Chart: BMFD**
* **ITD: 0µs (solid line with square markers):** Starts at approximately d' = 0 at IID = 0 dB, gradually increases to approximately d' = 1.5 at IID = -4 dB.
* **ITD: 10µs (solid line with circle markers):** Starts at approximately d' = 0.5 at IID = 0 dB, increases to approximately d' = 0.7 at IID = -1 dB, then increases sharply to approximately d' = 1.9 at IID = -3 dB.
* **ITD: 20µs (dotted line with diamond markers):** Starts at approximately d' = 0.7 at IID = 0 dB, increases to approximately d' = 0.8 at IID = -1 dB, then increases sharply to approximately d' = 1.8 at IID = -3 dB.
* **ITD: 30µs (dashed line with inverted triangle markers):** Starts at approximately d' = 0.9 at IID = 0 dB, increases sharply to approximately d' = 2.0 at IID = -1 dB.
* **ITD: 40µs (dash-dot line with triangle markers):** Starts at approximately d' = 0.9 at IID = 0 dB, increases sharply to approximately d' = 2.1 at IID = -1 dB.
### Key Observations
* In the top chart, the d' values for ITDs of 0µs, 10µs, and 20µs increase with decreasing IID, while the d' values for ITDs of 30µs and 40µs remain relatively constant.
* In the bottom chart, the d' values for all ITDs generally increase with decreasing IID. The increase is more pronounced for ITDs of 10µs, 20µs, 30µs, and 40µs.
* The "detect limit" line in the top chart provides a reference point for the discriminability index.
### Interpretation
The charts illustrate the relationship between interaural intensity difference (IID) and discriminability (d') for different interaural time differences (ITD). The top chart, representing "BI<sub>L,R</sub> (BI<sub>L,C,R</sub>)", shows that for smaller ITDs (0µs, 10µs, 20µs), discriminability improves as the IID becomes more negative. However, for larger ITDs (30µs, 40µs), discriminability remains relatively constant regardless of the IID. The bottom chart, representing "BMFD", shows that discriminability generally improves with decreasing IID for all ITDs, with a more pronounced increase for ITDs of 10µs, 20µs, 30µs, and 40µs. This suggests that the BMFD measure is more sensitive to changes in IID across different ITDs compared to the BI<sub>L,R</sub> measure. The "detect limit" in the top chart likely represents a threshold above which the difference in stimuli can be reliably detected.