## Chart: d' vs. IID for Different ITDs
### Overview
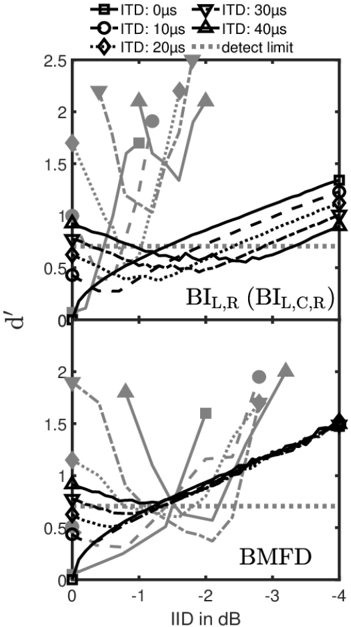
The image presents two line graphs displaying the relationship between d' (a measure of sensitivity) and Interaural Intensity Difference (IID) in dB, for different Interaural Time Differences (ITDs) in microseconds. The top graph represents data for BI<sub>L,R</sub> (BI<sub>L,C,R</sub>), and the bottom graph represents data for BMFD. Arrows indicate the direction of increasing ITD. A dashed horizontal line represents the detect limit.
### Components/Axes
* **X-axis (Both Graphs):** IID in dB, ranging from 0 to -4 dB.
* **Y-axis (Both Graphs):** d', ranging from 0 to 2.5.
* **Legend (Top-Left):**
* ITD: 0 µs (represented by a black square)
* ITD: 10 µs (represented by a white circle)
* ITD: 20 µs (represented by a grey diamond)
* ITD: 30 µs (represented by a black triangle pointing up)
* ITD: 40 µs (represented by a black triangle pointing down)
* detect limit (represented by a dashed grey line)
* **Labels:**
* Top Graph: BI<sub>L,R</sub> (BI<sub>L,C,R</sub>)
* Bottom Graph: BMFD
### Detailed Analysis or Content Details
**Top Graph (BI<sub>L,R</sub> (BI<sub>L,C,R</sub>))**
* **ITD: 0 µs (Black Square):** The line starts at approximately d' = 0 at IID = 0 dB, increases to approximately d' = 1.2 at IID = -1 dB, then plateaus around d' = 1.3 to 1.4 from IID = -1 dB to -4 dB.
* **ITD: 10 µs (White Circle):** The line starts at approximately d' = 0 at IID = 0 dB, increases to approximately d' = 1.0 at IID = -0.5 dB, then decreases to approximately d' = 0.6 at IID = -4 dB.
* **ITD: 20 µs (Grey Diamond):** The line starts at approximately d' = 0 at IID = 0 dB, increases rapidly to approximately d' = 2.0 at IID = -0.5 dB, then decreases to approximately d' = 1.2 at IID = -4 dB.
* **ITD: 30 µs (Black Triangle Up):** The line starts at approximately d' = 0 at IID = 0 dB, increases to approximately d' = 1.6 at IID = -1 dB, then plateaus around d' = 1.5 to 1.6 from IID = -1 dB to -4 dB.
* **ITD: 40 µs (Black Triangle Down):** The line starts at approximately d' = 0 at IID = 0 dB, increases to approximately d' = 1.4 at IID = -0.5 dB, then decreases to approximately d' = 0.8 at IID = -4 dB.
* **Detect Limit (Dashed Grey Line):** A horizontal line at approximately d' = 0.5.
**Bottom Graph (BMFD)**
* **ITD: 0 µs (Black Square):** The line starts at approximately d' = 0 at IID = 0 dB, increases to approximately d' = 1.2 at IID = -1 dB, then plateaus around d' = 1.3 to 1.4 from IID = -1 dB to -4 dB.
* **ITD: 10 µs (White Circle):** The line starts at approximately d' = 0 at IID = 0 dB, increases to approximately d' = 0.8 at IID = -0.5 dB, then decreases to approximately d' = 0.5 at IID = -4 dB.
* **ITD: 20 µs (Grey Diamond):** The line starts at approximately d' = 0 at IID = 0 dB, increases rapidly to approximately d' = 1.8 at IID = -0.5 dB, then decreases to approximately d' = 1.0 at IID = -4 dB.
* **ITD: 30 µs (Black Triangle Up):** The line starts at approximately d' = 0 at IID = 0 dB, increases to approximately d' = 1.5 at IID = -1 dB, then plateaus around d' = 1.4 to 1.5 from IID = -1 dB to -4 dB.
* **ITD: 40 µs (Black Triangle Down):** The line starts at approximately d' = 0 at IID = 0 dB, increases to approximately d' = 1.2 at IID = -0.5 dB, then decreases to approximately d' = 0.7 at IID = -4 dB.
* **Detect Limit (Dashed Grey Line):** A horizontal line at approximately d' = 0.5.
### Key Observations
* In both graphs, increasing ITD generally leads to a higher d' value at smaller negative IID values, but this effect diminishes or reverses at more negative IID values.
* The 20 µs ITD consistently shows the highest d' values at smaller negative IID values in both graphs.
* The detect limit appears to be crossed by all ITD curves at some point, indicating that the stimulus is detectable under those conditions.
* The lines for ITD 0 µs and 30 µs are very similar in both graphs.
### Interpretation
The data suggests that sensitivity (d') to sound localization cues is influenced by both IID and ITD. The optimal ITD for detection appears to be around 20 µs, as evidenced by the highest d' values at smaller negative IID values. However, as IID becomes more negative, the benefit of this optimal ITD diminishes, and other ITDs may become more effective. The detect limit indicates the minimum level of sensitivity required for a stimulus to be reliably detected. The differences between the BI<sub>L,R</sub> (BI<sub>L,C,R</sub>) and BMFD graphs suggest that the specific processing mechanism (represented by these labels) influences the relationship between IID, ITD, and sensitivity. The arrows indicate that as ITD increases, the sensitivity increases, but this effect is not linear and is dependent on the IID. The data could be used to model human auditory perception and to understand how the brain integrates IID and ITD to localize sounds.