## Line Graph: Detection Performance vs. Interaural Intensity Difference (IID)
### Overview
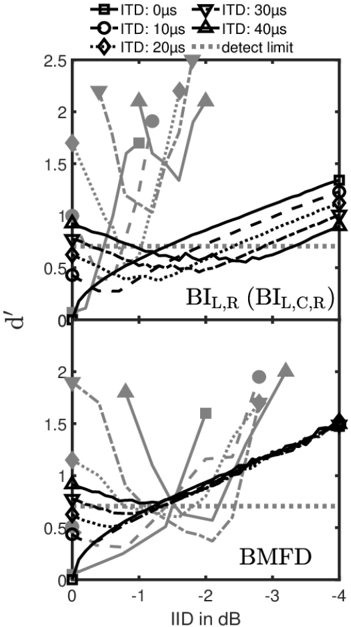
The image contains two subplots comparing detection performance (d/d') across varying interaural intensity differences (IID in dB) for different interaural time differences (ITD). The top subplot focuses on "BI_L,R (BI_L,C,R)" and the bottom on "BMFD". Data points are marked with symbols corresponding to ITD values (0µs, 10µs, 20µs, 30µs, 40µs), and a dashed line indicates the "detect limit" at d/d' = 1.
---
### Components/Axes
- **X-axis (Horizontal)**:
- Label: "IID in dB"
- Range: -4 to 0 (in increments of 1 dB)
- Position: Bottom of both subplots
- **Y-axis (Vertical)**:
- Label: "d/d'"
- Range: 0 to 2.5 (in increments of 0.5)
- Position: Left of both subplots
- **Legend**:
- Located in the top-left corner of the image.
- Symbols:
- **Squares**: ITD = 0µs
- **Circles**: ITD = 10µs
- **Triangles**: ITD = 30µs
- **Diamonds**: ITD = 20µs
- **Dashed lines**: Detect limit (d/d' = 1)
- **Subplots**:
- **Top**: Labeled "BI_L,R (BI_L,C,R)" in the bottom-right corner.
- **Bottom**: Labeled "BMFD" in the bottom-right corner.
---
### Detailed Analysis
#### Top Subplot (BI_L,R / BI_L,C,R):
1. **ITD = 0µs (Squares)**:
- Starts at (IID = -4 dB, d/d' ≈ 0.2) and rises sharply to (IID = 0 dB, d/d' ≈ 1.5).
- Crosses the detect limit (d/d' = 1) at IID ≈ -2 dB.
2. **ITD = 10µs (Circles)**:
- Begins at (IID = -4 dB, d/d' ≈ 0.1) and increases gradually.
- Crosses the detect limit at IID ≈ -1.5 dB.
3. **ITD = 20µs (Diamonds)**:
- Starts at (IID = -4 dB, d/d' ≈ 0.3) and rises steeply.
- Crosses the detect limit at IID ≈ -1.8 dB.
4. **ITD = 30µs (Triangles)**:
- Begins at (IID = -4 dB, d/d' ≈ 0.4) and increases sharply.
- Crosses the detect limit at IID ≈ -1.2 dB.
5. **ITD = 40µs (Diamonds)**:
- Starts at (IID = -4 dB, d/d' ≈ 0.5) and rises steeply.
- Crosses the detect limit at IID ≈ -0.8 dB.
#### Bottom Subplot (BMFD):
1. **ITD = 0µs (Squares)**:
- Starts at (IID = -4 dB, d/d' ≈ 0.1) and rises gradually.
- Crosses the detect limit at IID ≈ -2.5 dB.
2. **ITD = 10µs (Circles)**:
- Begins at (IID = -4 dB, d/d' ≈ 0.2) and increases slowly.
- Crosses the detect limit at IID ≈ -2 dB.
3. **ITD = 20µs (Diamonds)**:
- Starts at (IID = -4 dB, d/d' ≈ 0.3) and rises steeply.
- Crosses the detect limit at IID ≈ -1.5 dB.
4. **ITD = 30µs (Triangles)**:
- Begins at (IID = -4 dB, d/d' ≈ 0.4) and increases sharply.
- Crosses the detect limit at IID ≈ -1 dB.
5. **ITD = 40µs (Diamonds)**:
- Starts at (IID = -4 dB, d/d' ≈ 0.5) and rises steeply.
- Crosses the detect limit at IID ≈ -0.5 dB.
---
### Key Observations
1. **Detect Limit Threshold**:
- All ITD values eventually cross the detect limit (d/d' = 1), but performance improves with higher ITDs.
- For example, ITD = 40µs crosses the threshold at IID = -0.8 dB (top subplot), while ITD = 0µs requires IID = -2 dB.
2. **Performance Trends**:
- Higher ITDs (e.g., 30µs, 40µs) achieve higher d/d' values at the same IID compared to lower ITDs.
- The BMFD subplot shows consistently lower d/d' values than BI_L,R across all ITDs.
3. **Anomalies**:
- In the top subplot, the ITD = 20µs (diamonds) line dips below the detect limit at IID = -3 dB, suggesting reduced performance at extreme IID values.
---
### Interpretation
- **Detection Capability**:
- The graph demonstrates that detection performance (d/d') improves with larger ITDs, particularly at lower IID values. This suggests that temporal cues (ITD) enhance localization accuracy in noisy environments.
- **Model Comparison**:
- The BI_L,R (BI_L,C,R) model outperforms BMFD across all ITDs, indicating that the former may better capture interaural cues for sound localization.
- **Practical Implications**:
- Systems relying on ITD cues (e.g., hearing aids, binaural audio processing) could prioritize higher ITD values to improve detection thresholds in challenging acoustic conditions.
- **Uncertainty**:
- Exact d/d' values are approximate due to the lack of gridlines. For example, the ITD = 40µs line in the top subplot crosses the detect limit at IID ≈ -0.8 dB, but the precise value may vary slightly.