## Stacked Bar Chart: GPT-2 xl Head Distribution Across Layers
### Overview
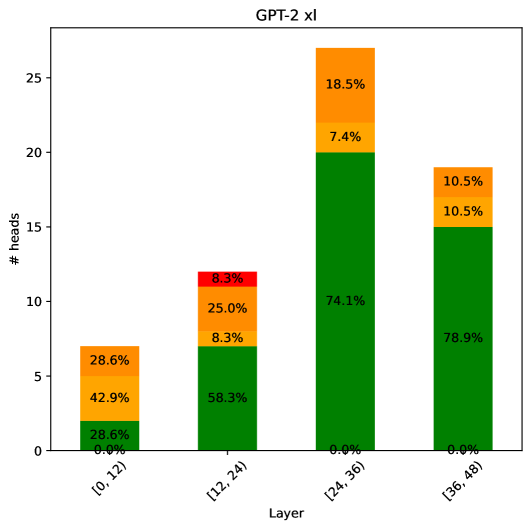
The image is a stacked bar chart visualizing the distribution of attention heads in the GPT-2 xl model across different layer groups. The x-axis represents the layer groups, and the y-axis represents the number of heads. Each bar is segmented into colored sections, each representing a different head type, with percentages indicating the proportion of each head type within that layer group.
### Components/Axes
* **Title:** GPT-2 xl
* **X-axis:** Layer, with categories \[0, 12), \[12, 24), \[24, 36), \[36, 48)
* **Y-axis:** # heads, with a scale from 0 to 25 in increments of 5.
* **Bar Segments:** Each bar is divided into sections, each with a percentage label. The colors are green, orange, and red.
### Detailed Analysis
The chart displays the distribution of attention heads across four layer groups. The height of each segment represents the number of heads of that type within the layer group.
* **Layer \[0, 12):**
* Green: 28.6%
* Orange: 42.9%
* Red: 28.6%
* Total height of the bar is approximately 7 heads.
* **Layer \[12, 24):**
* Green: 58.3%
* Orange: 25.0%
* Red: 8.3%
* Total height of the bar is approximately 12 heads.
* **Layer \[24, 36):**
* Green: 74.1%
* Orange: 7.4%
* Red: 18.5%
* Total height of the bar is approximately 27 heads.
* **Layer \[36, 48):**
* Green: 78.9%
* Orange: 10.5%
* Red: 10.5%
* Total height of the bar is approximately 20 heads.
### Key Observations
* The number of heads increases from layer group \[0, 12) to \[24, 36), then decreases slightly in \[36, 48).
* The proportion of green heads (likely representing a specific type of attention) increases significantly from \[0, 12) to \[36, 48).
* The proportion of orange heads decreases from \[0, 12) to \[24, 36), then increases slightly in \[36, 48).
* The proportion of red heads decreases from \[0, 12) to \[12, 24), increases in \[24, 36), then decreases in \[36, 48).
### Interpretation
The chart illustrates how the distribution of different types of attention heads changes across the layers of the GPT-2 xl model. The increasing proportion of green heads in later layers suggests that this type of attention may become more important as the model processes information through deeper layers. The variations in the proportions of orange and red heads may reflect different roles or specializations of these attention types within the model. The peak in the total number of heads in layer group \[24, 36) could indicate a critical processing stage within the model's architecture.