## Stacked Bar Chart: GPT-2 xl Layer Activation Distribution
### Overview
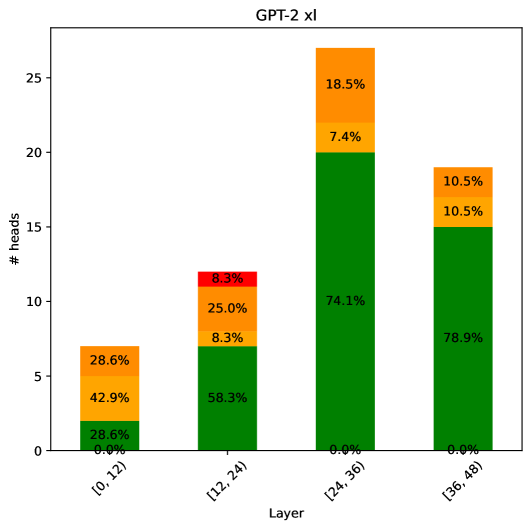
This is a stacked bar chart visualizing the distribution of activations across different layers of the GPT-2 xl model. The chart displays the number of "heads" (likely referring to attention heads) for each layer, broken down by activation percentage ranges. The x-axis represents the layer, divided into four ranges: [0, 12], [12, 24], [24, 36], and [36, 48]. The y-axis represents the number of heads. Each bar is segmented into color-coded sections representing the percentage of heads with activations falling within specific ranges.
### Components/Axes
* **Title:** GPT-2 xl (positioned at the top-center)
* **X-axis Label:** Layer (positioned at the bottom-center)
* **Y-axis Label:** # heads (positioned at the left-center)
* **X-axis Markers:** [0, 12], [12, 24], [24, 36], [36, 48]
* **Y-axis Scale:** 0 to 25 (approximately)
* **Color Legend (Implicit):**
* Light Yellow: 0.0% - ~28.6%
* Dark Yellow: ~28.6% - ~42.9%
* Orange: ~42.9% - ~18.5%
* Red: ~8.3%
* Green: ~58.3% - ~78.9%
### Detailed Analysis
The chart consists of four stacked bars, one for each layer range.
* **Layer [0, 12]:**
* Light Yellow: 28.6% (approximately 2.8 heads)
* Dark Yellow: 42.9% (approximately 4.3 heads)
* Orange: 28.6% (approximately 2.9 heads)
* Total Heads: ~10 heads
* **Layer [12, 24]:**
* Light Yellow: 58.3% (approximately 5.8 heads)
* Dark Yellow: 8.3% (approximately 0.8 heads)
* Orange: 25.0% (approximately 2.5 heads)
* Red: 8.3% (approximately 0.8 heads)
* Total Heads: ~10 heads
* **Layer [24, 36]:**
* Green: 74.1% (approximately 18.5 heads)
* Orange: 18.5% (approximately 4.6 heads)
* Dark Yellow: 7.4% (approximately 1.8 heads)
* Total Heads: ~25 heads
* **Layer [36, 48]:**
* Green: 78.9% (approximately 19.7 heads)
* Orange: 10.5% (approximately 2.6 heads)
* Dark Yellow: 10.5% (approximately 2.6 heads)
* Total Heads: ~25 heads
### Key Observations
* The number of heads appears to increase from layer [0, 12] to layer [12, 24], and then remains relatively constant for layers [24, 36] and [36, 48].
* The distribution of activations shifts significantly across layers. Early layers ([0, 12] and [12, 24]) have a more even distribution of activations across the lower percentage ranges (yellow and orange).
* Later layers ([24, 36] and [36, 48]) are dominated by high activation percentages (green), indicating a greater proportion of heads are strongly activated in these layers.
* The red segment is only present in the [12, 24] layer, and represents a small percentage of heads.
### Interpretation
This chart likely illustrates how the activation patterns change as information flows through the GPT-2 xl model. The early layers seem to distribute activations more broadly, potentially capturing a wider range of features. As the information progresses through the network, the activations become more concentrated in a smaller number of heads, suggesting that the model is focusing on the most relevant features for the task at hand. The increase in the number of heads in the later layers, combined with the dominance of high activation percentages, could indicate that these layers are responsible for more complex processing and decision-making. The presence of the red segment in the [12, 24] layer might represent a specific type of feature or pattern that is particularly relevant during that stage of processing. The chart suggests a clear trend of increasing specialization and focus as data moves deeper into the GPT-2 xl model.