TECHNICAL ASSET FINGERPRINT
faff259f7f04320039aa8707
Click to view fullscreen
Press ESC or click to close
FOUND IN PAPERS
EXPERT: gemini-2.0-flash VERSION 1
RUNTIME: nugit/gemini/gemini-2.0-flash
INTEL_VERIFIED
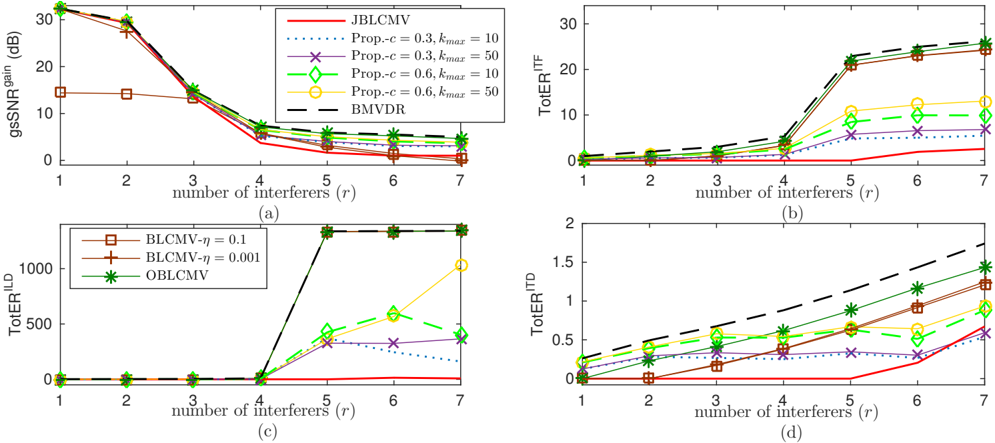
## Chart: Performance Metrics vs. Number of Interferers
### Overview
The image presents four line charts arranged in a 2x2 grid, each displaying a different performance metric as a function of the number of interferers. The metrics are gsSNR gain (dB), TotER^{ITF}, TotER^{ILD}, and TotER^{ITD}. The x-axis represents the number of interferers (r), ranging from 1 to 7 in all four charts. Different lines represent different algorithms or parameter settings.
### Components/Axes
**General Components:**
* **X-axis (all charts):** Number of interferers (r), ranging from 1 to 7.
* **Legends:** Two legends are present. The top-right legend applies to the top two charts, and the bottom-left legend applies to the bottom two charts.
**Chart (a): gsSNR^{gain} (dB)**
* **Y-axis:** gsSNR^{gain} (dB), ranging from 0 to 30.
* **Legend (Top-Right):**
* Red solid line: JBLCMV
* Blue dotted line: Prop.-c = 0.3, k_{max} = 10
* Purple line with x markers: Prop.-c = 0.3, k_{max} = 50
* Green dashed line with diamond markers: Prop.-c = 0.6, k_{max} = 10
* Yellow line with circle markers: Prop.-c = 0.6, k_{max} = 50
* Black dashed line: BMVDR
**Chart (b): TotER^{ITF}**
* **Y-axis:** TotER^{ITF}, ranging from 0 to 30.
* **Legend (Top-Right):** Same as Chart (a).
**Chart (c): TotER^{ILD}**
* **Y-axis:** TotER^{ILD}, ranging from 0 to 1000.
* **Legend (Bottom-Left):**
* Brown line with square markers: BLCMV-η = 0.1
* Dark-Brown line with plus markers: BLCMV-η = 0.001
* Green line with star markers: OBLCMV
**Chart (d): TotER^{ITD}**
* **Y-axis:** TotER^{ITD}, ranging from 0 to 2.
* **Legend (Bottom-Left):** Same as Chart (c).
### Detailed Analysis
**Chart (a): gsSNR^{gain} (dB)**
* **JBLCMV (Red solid line):** Starts at approximately 31 dB and decreases sharply to around 3 dB by r=4, then remains relatively constant.
* **Prop.-c = 0.3, k_{max} = 10 (Blue dotted line):** Starts at approximately 31 dB, decreases to around 4 dB by r=4, then remains relatively constant.
* **Prop.-c = 0.3, k_{max} = 50 (Purple line with x markers):** Starts at approximately 31 dB, decreases to around 4 dB by r=4, then remains relatively constant.
* **Prop.-c = 0.6, k_{max} = 10 (Green dashed line with diamond markers):** Starts at approximately 31 dB, decreases to around 5 dB by r=4, then remains relatively constant.
* **Prop.-c = 0.6, k_{max} = 50 (Yellow line with circle markers):** Starts at approximately 31 dB, decreases to around 5 dB by r=4, then remains relatively constant.
* **BMVDR (Black dashed line):** Starts at approximately 31 dB, decreases to around 5 dB by r=4, then remains relatively constant.
* **BLCMV-η = 0.1 (Brown line with square markers):** Starts at approximately 14 dB, remains relatively constant until r=3, then decreases to around 3 dB by r=4, then remains relatively constant.
* **BLCMV-η = 0.001 (Dark-Brown line with plus markers):** Starts at approximately 31 dB, decreases to around 3 dB by r=4, then remains relatively constant.
**Chart (b): TotER^{ITF}**
* **JBLCMV (Red solid line):** Remains close to 0 for r=1 to r=4, then increases to approximately 2 by r=7.
* **Prop.-c = 0.3, k_{max} = 10 (Blue dotted line):** Remains close to 0 for r=1 to r=4, then increases to approximately 3 by r=7.
* **Prop.-c = 0.3, k_{max} = 50 (Purple line with x markers):** Remains close to 0 for r=1 to r=4, then increases to approximately 7 by r=7.
* **Prop.-c = 0.6, k_{max} = 10 (Green dashed line with diamond markers):** Remains close to 0 for r=1 to r=4, then increases to approximately 10 by r=7.
* **Prop.-c = 0.6, k_{max} = 50 (Yellow line with circle markers):** Remains close to 0 for r=1 to r=4, then increases to approximately 25 by r=7.
* **BMVDR (Black dashed line):** Starts at approximately 1, increases to approximately 26 by r=7.
* **BLCMV-η = 0.1 (Brown line with square markers):** Remains close to 0 for r=1 to r=4, then increases to approximately 26 by r=7.
* **BLCMV-η = 0.001 (Dark-Brown line with plus markers):** Remains close to 0 for r=1 to r=4, then increases to approximately 26 by r=7.
**Chart (c): TotER^{ILD}**
* **BLCMV-η = 0.1 (Brown line with square markers):** Remains close to 0 until r=5, then increases sharply to approximately 1500 by r=7.
* **BLCMV-η = 0.001 (Dark-Brown line with plus markers):** Remains close to 0.
* **OBLCMV (Green line with star markers):** Remains close to 0 until r=5, then increases sharply to approximately 700 by r=7.
* **JBLCMV (Red solid line):** Remains close to 0.
* **Prop.-c = 0.3, k_{max} = 10 (Blue dotted line):** Remains close to 0 until r=5, then increases to approximately 400 by r=7.
* **Prop.-c = 0.3, k_{max} = 50 (Purple line with x markers):** Remains close to 0 until r=5, then increases to approximately 500 by r=7.
* **Prop.-c = 0.6, k_{max} = 10 (Green dashed line with diamond markers):** Remains close to 0 until r=5, then increases to approximately 600 by r=7.
* **Prop.-c = 0.6, k_{max} = 50 (Yellow line with circle markers):** Remains close to 0 until r=5, then increases to approximately 1000 by r=7.
* **BMVDR (Black dashed line):** Remains close to 0 until r=5, then increases sharply to approximately 1500 by r=7.
**Chart (d): TotER^{ITD}**
* **BLCMV-η = 0.1 (Brown line with square markers):** Remains close to 0.
* **BLCMV-η = 0.001 (Dark-Brown line with plus markers):** Starts at approximately 0, increases to approximately 0.6 by r=7.
* **OBLCMV (Green line with star markers):** Starts at approximately 0.2, increases to approximately 1.2 by r=7.
* **JBLCMV (Red solid line):** Starts at approximately 0, increases to approximately 0.6 by r=7.
* **Prop.-c = 0.3, k_{max} = 10 (Blue dotted line):** Starts at approximately 0.2, increases to approximately 0.4 by r=7.
* **Prop.-c = 0.3, k_{max} = 50 (Purple line with x markers):** Starts at approximately 0.2, increases to approximately 0.5 by r=7.
* **Prop.-c = 0.6, k_{max} = 10 (Green dashed line with diamond markers):** Starts at approximately 0.2, increases to approximately 0.7 by r=7.
* **Prop.-c = 0.6, k_{max} = 50 (Yellow line with circle markers):** Starts at approximately 0.2, increases to approximately 0.9 by r=7.
* **BMVDR (Black dashed line):** Starts at approximately 0.2, increases to approximately 1 by r=7.
### Key Observations
* In Chart (a), gsSNR^{gain} generally decreases as the number of interferers increases.
* In Charts (b), (c), and (d), TotER metrics generally increase as the number of interferers increases.
* The BLCMV-η = 0.1 algorithm shows a sharp increase in TotER^{ILD} after r=5.
* The BMVDR algorithm shows a sharp increase in TotER^{ILD} after r=5.
### Interpretation
The charts illustrate the performance of different beamforming algorithms under varying interference conditions. The gsSNR^{gain} metric reflects the signal quality, which degrades as more interferers are present. The TotER metrics (ITF, ILD, ITD) represent different types of error, which generally increase with the number of interferers.
The sharp increase in TotER^{ILD} for BLCMV-η = 0.1 and BMVDR after r=5 suggests that these algorithms become unstable or less effective when dealing with a high number of interferers. The other algorithms exhibit more gradual increases in error, indicating better robustness to interference.
The different parameter settings for the "Prop.-c" algorithm (k_{max} = 10 vs. k_{max} = 50, and c = 0.3 vs. c = 0.6) also influence performance, with some combinations showing better error rates than others.
DECODING INTELLIGENCE...