## Charts: Performance Comparison of Beamforming Algorithms
### Overview
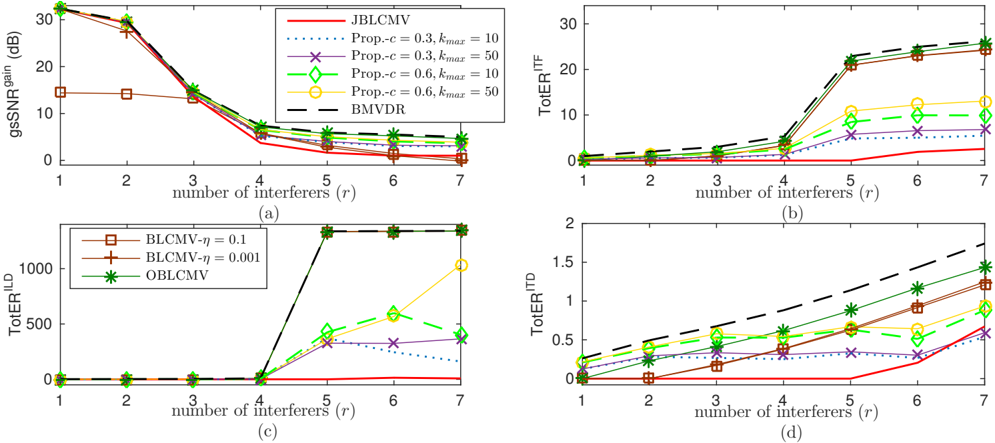
The image contains four separate charts (labeled (a), (b), (c), and (d)) comparing the performance of several beamforming algorithms as a function of the number of interferers. The charts plot different performance metrics (gSSNR gain, ToER<sup>ITE</sup>, ToER<sup>ILD</sup>, and ToER<sup>ITD</sup>) against the number of interferers.
### Components/Axes
Each chart shares a common x-axis:
* **X-axis:** Number of interferers (r), ranging from 1 to 7.
Each chart has a unique y-axis:
* **(a):** gSSNR gain (dB), ranging from 0 to 30.
* **(b):** ToER<sup>ITE</sup>, ranging from 0 to 30.
* **(c):** ToER<sup>ILD</sup>, ranging from 0 to 1000.
* **(d):** ToER<sup>ITD</sup>, ranging from 0 to 2.
Each chart also includes a legend identifying the different algorithms/parameter settings.
### Detailed Analysis or Content Details
**Chart (a): gSSNR gain (dB) vs. Number of Interferers (r)**
* **JBLCMV (Red Solid Line):** Starts at approximately 30 dB at r=1, rapidly decreases to approximately 5 dB at r=2, and continues to decrease to approximately 2 dB at r=7.
* **Prop-c = 0.3, k<sub>max</sub> = 50 (Orange Dotted Line):** Starts at approximately 25 dB at r=1, decreases to approximately 10 dB at r=2, and stabilizes around 5 dB for r > 3.
* **Prop-c = 0.3, k<sub>max</sub> = 10 (Green Dashed Line):** Starts at approximately 20 dB at r=1, decreases to approximately 8 dB at r=2, and stabilizes around 3 dB for r > 3.
* **Prop-c = 0.6, k<sub>max</sub> = 50 (Yellow Solid Line):** Starts at approximately 18 dB at r=1, decreases to approximately 6 dB at r=2, and stabilizes around 2 dB for r > 3.
* **BMVDR (Black Dashed-Dot Line):** Remains relatively constant around 2 dB across all values of r.
**Chart (b): ToER<sup>ITE</sup> vs. Number of Interferers (r)**
* **JBLCMV (Red Solid Line):** Remains relatively constant around 2 dB across all values of r.
* **Prop-c = 0.3, k<sub>max</sub> = 50 (Orange Dotted Line):** Starts at approximately 2 dB at r=1, increases to approximately 20 dB at r=7.
* **Prop-c = 0.3, k<sub>max</sub> = 10 (Green Dashed Line):** Starts at approximately 2 dB at r=1, increases to approximately 10 dB at r=7.
* **Prop-c = 0.6, k<sub>max</sub> = 50 (Yellow Solid Line):** Starts at approximately 2 dB at r=1, increases to approximately 15 dB at r=7.
* **BMVDR (Black Dashed-Dot Line):** Remains relatively constant around 2 dB across all values of r.
**Chart (c): ToER<sup>ILD</sup> vs. Number of Interferers (r)**
* **BLCMV-η = 0.1 (Red Square Markers):** Remains relatively constant around 0 dB for r=1 to r=4, then increases sharply to approximately 800 dB at r=7.
* **BLCMV-η = 0.001 (Red Circle Markers):** Remains relatively constant around 0 dB for r=1 to r=4, then increases sharply to approximately 1000 dB at r=7.
* **OBLCMV (Green Star Markers):** Remains relatively constant around 0 dB for r=1 to r=4, then increases to approximately 200 dB at r=7.
**Chart (d): ToER<sup>ITD</sup> vs. Number of Interferers (r)**
* **BLCMV-η = 0.1 (Red Square Markers):** Remains relatively constant around 0.2 dB for r=1 to r=4, then increases to approximately 1.5 dB at r=7.
* **BLCMV-η = 0.001 (Red Circle Markers):** Remains relatively constant around 0.2 dB for r=1 to r=4, then increases to approximately 1.2 dB at r=7.
* **OBLCMV (Green Star Markers):** Remains relatively constant around 0.1 dB for r=1 to r=4, then increases to approximately 1.8 dB at r=7.
### Key Observations
* In Chart (a), JBLCMV exhibits the highest gSSNR gain at low interferer counts but degrades rapidly as the number of interferers increases.
* In Chart (b), ToER<sup>ITE</sup> generally increases with the number of interferers for the "Prop-c" algorithms, while JBLCMV and BMVDR remain relatively constant.
* Charts (c) and (d) show a significant increase in ToER<sup>ILD</sup> and ToER<sup>ITD</sup> for all algorithms as the number of interferers increases, particularly for BLCMV with smaller η values.
* BMVDR consistently performs poorly in terms of gSSNR gain (Chart a) but maintains a stable ToER<sup>ITE</sup> (Chart b).
### Interpretation
These charts compare the performance of different beamforming algorithms under varying levels of interference. The algorithms are evaluated based on several metrics: gSSNR gain (signal-to-noise ratio), and different measures of ToER (tracking error rate).
The rapid degradation of JBLCMV's gSSNR gain with increasing interferers suggests it is sensitive to interference. The "Prop-c" algorithms offer a more stable performance in terms of gSSNR gain, but at the cost of lower initial gain. The consistent performance of BMVDR in ToER<sup>ITE</sup> indicates its robustness to interference in this specific metric.
The increasing ToER<sup>ILD</sup> and ToER<sup>ITD</sup> with the number of interferers in Charts (c) and (d) suggest that the algorithms struggle to accurately estimate the direction of arrival (DOA) in highly interfering environments. The performance difference between BLCMV with different η values and OBLCMV suggests that the choice of regularization parameter (η) can significantly impact performance in these scenarios.
The charts demonstrate a trade-off between different performance metrics. An algorithm that excels in one metric may perform poorly in another, highlighting the need to carefully consider the specific application requirements when selecting a beamforming algorithm. The data suggests that the optimal algorithm depends on the level of interference and the relative importance of different performance metrics.