## Line Chart: Hits@10 Values (%) vs. Training Epochs
### Overview
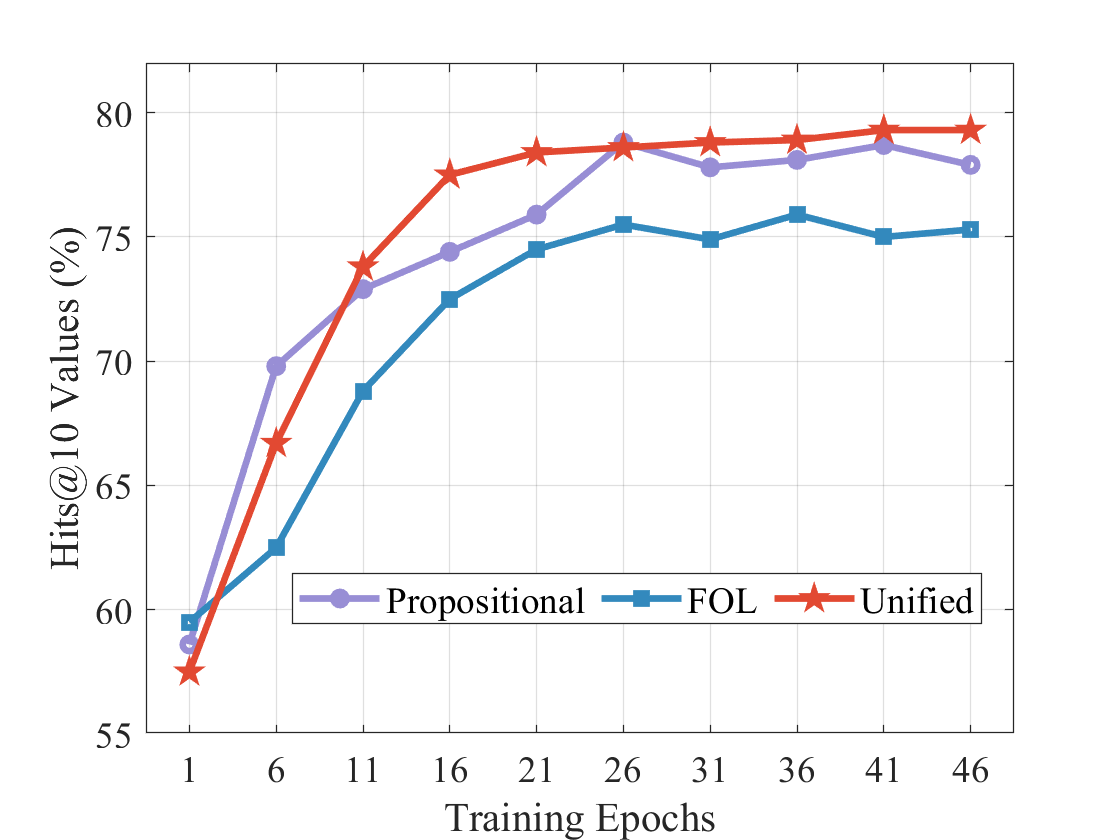
The image is a line chart comparing the performance of three different models ("Propositional", "FOL", and "Unified") over a range of training epochs. The y-axis represents "Hits@10 Values (%)", indicating the percentage of correct predictions within the top 10 predictions. The x-axis represents "Training Epochs", showing the number of training iterations.
### Components/Axes
* **Title:** None explicitly present in the image.
* **X-axis:**
* Label: "Training Epochs"
* Scale: 1 to 46, with markers at intervals of 5 (1, 6, 11, 16, 21, 26, 31, 36, 41, 46).
* **Y-axis:**
* Label: "Hits@10 Values (%)"
* Scale: 55 to 80, with markers at intervals of 5 (55, 60, 65, 70, 75, 80).
* **Legend:** Located at the bottom of the chart.
* Propositional (light purple line with circle markers)
* FOL (blue line with square markers)
* Unified (red line with star markers)
### Detailed Analysis
* **Propositional (light purple line with circle markers):**
* Trend: Initially increases sharply, then plateaus and slightly decreases towards the end.
* Data Points:
* Epoch 1: ~58%
* Epoch 6: ~70%
* Epoch 11: ~73%
* Epoch 16: ~75%
* Epoch 21: ~76%
* Epoch 26: ~78%
* Epoch 31: ~77%
* Epoch 36: ~78%
* Epoch 41: ~79%
* Epoch 46: ~78%
* **FOL (blue line with square markers):**
* Trend: Increases steadily, plateaus, and remains relatively stable.
* Data Points:
* Epoch 1: ~59%
* Epoch 6: ~62%
* Epoch 11: ~69%
* Epoch 16: ~72%
* Epoch 21: ~74%
* Epoch 26: ~75.5%
* Epoch 31: ~75%
* Epoch 36: ~76%
* Epoch 41: ~75%
* Epoch 46: ~75.5%
* **Unified (red line with star markers):**
* Trend: Increases rapidly, plateaus, and remains relatively stable at the highest performance level.
* Data Points:
* Epoch 1: ~57.5%
* Epoch 6: ~67%
* Epoch 11: ~74%
* Epoch 16: ~77%
* Epoch 21: ~78%
* Epoch 26: ~79%
* Epoch 31: ~79%
* Epoch 36: ~79%
* Epoch 41: ~79.5%
* Epoch 46: ~79%
### Key Observations
* The "Unified" model consistently outperforms the "Propositional" and "FOL" models.
* All three models show significant performance gains in the initial training epochs (1-26).
* The "Propositional" model shows a slight decrease in performance towards the end of the training epochs.
* The "FOL" model plateaus earlier than the "Unified" model.
### Interpretation
The chart demonstrates the performance of three different models ("Propositional", "FOL", and "Unified") as a function of training epochs. The "Unified" model achieves the highest "Hits@10 Values (%)", suggesting it is the most effective model for this task. The initial rapid increase in performance for all models indicates that the models are learning effectively during the early training stages. The plateauing of performance suggests that the models are reaching their maximum potential with the given training data and architecture. The slight decrease in performance for the "Propositional" model towards the end could indicate overfitting or other issues. The "Unified" model's consistently high performance suggests it is the most robust and well-suited for the task.